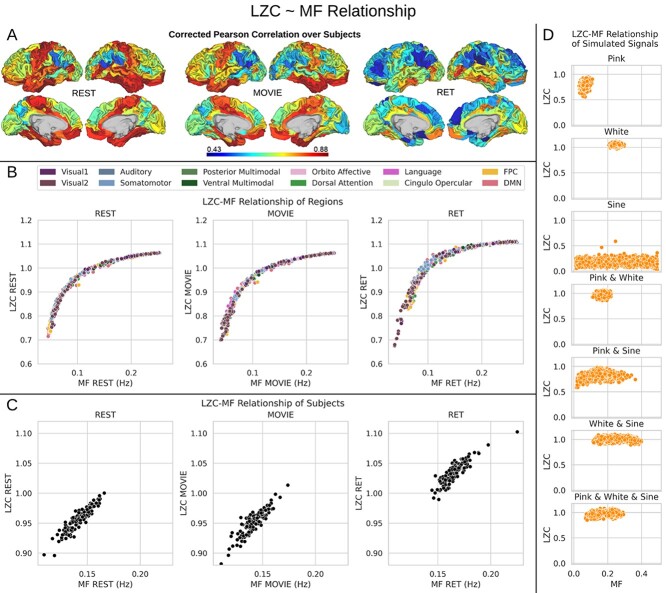
Fig. 5.
The relationship between MF and LZC. A) Regional Pearson correlation between MF and LZC or the 3 conditions of REST, MOVIE, and RET. P-values are corrected using the FDR method at  . The wide range of correlation values (0.43–0.88) suggests that topographical differences affect the MF–LZC relationship. B) Regional scatter plots of MF–LZC relationship for the 3 conditions. Each point is a region averaged over subjects, and the colors show the regions belonging to specific networks. All plots show LZC as a nonlinear function of MF. C) Scatter plots of MF–LZC relationship for different subjects in the 3 conditions. Each point is a subject averaged over regions. The nonlinear relationship can no longer be observed. D) Simulation of the MF–LZC relationship with 7 different types of signals. Each plot shows the distribution of LZC as a function of MF for 5,000 simulated signals. The nonlinear relationship cannot be observed in the simulated signals, suggesting that it is unique to the brain signal.

