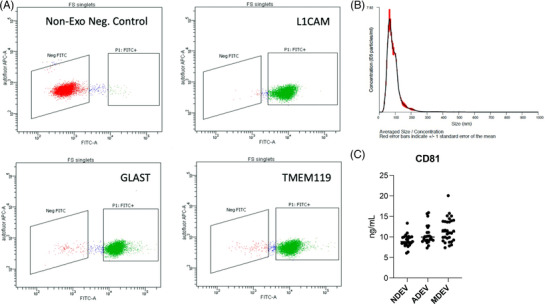
FIGURE 1.

Fluorescent activated cell sorting (FACS) enrichment of plasma NDEVs, ADEVs, and MDEVs from LATE‐NC subjects. Representative FACS plot for non‐EV, negative control (red) and BAE—FITC complexes generated from EVs (green) isolated a LATE‐NC subject and enriched against anti‐human CD171 biotin (L1‐CAM), anti‐GLAST, and anti‐TMEM119 antibody. (A) Representative plot of size/concentration determined by nanoparticle tracking analysis (NTA) for extracted plasma EVs from a LATE‐NC subject (B). Plasma concentrations of EV marker, CD81 as measured by hu‐specific ELISA. CD81 was not statistically different between the three groups (C).
