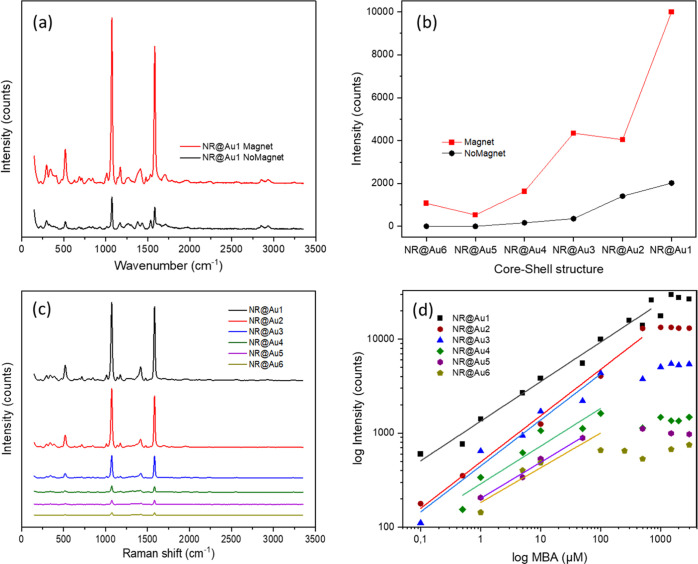
Figure 5.
(a) Raman spectra of MBA (0.1 mM) measured using a magnet and without it. (b) Intensity of the first characteristic peak of MBA (1072 cm–1) at 0.1 mM with each core–shell structure using a magnet and without it. (c) Raman spectra of MBA (1 mM) performed with each of the core–shell structure. (d) Intensity of the first characteristic peak of MBA (1072 cm–1) at different concentrations measured with each core@shell structure.

