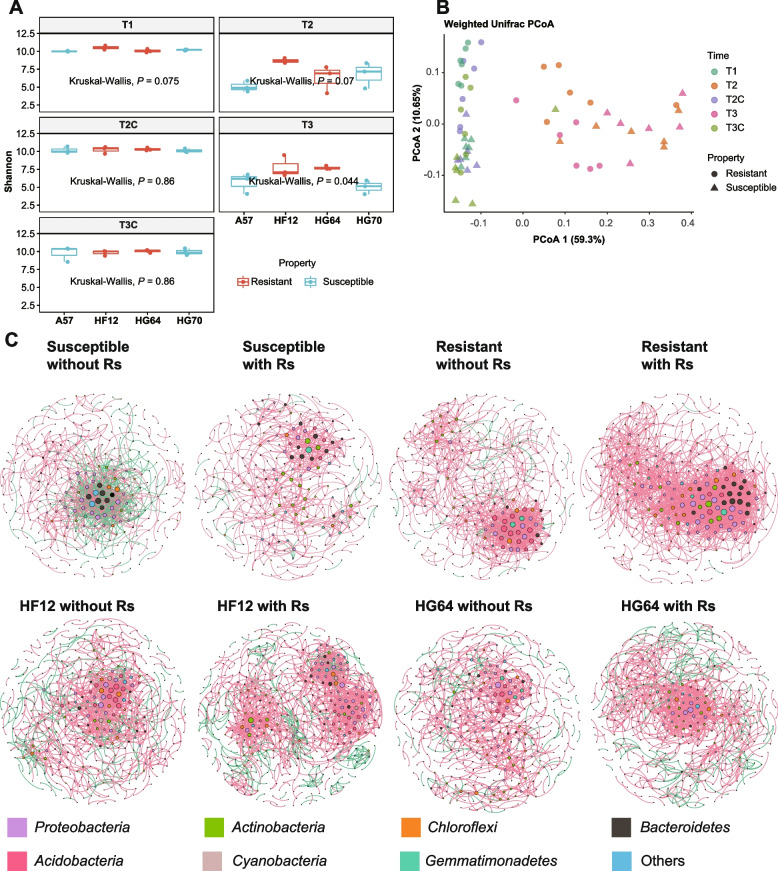
Fig. 2.
Stability of the resistant tomato cultivars. A Shannon indexes of the four cultivars at different sampling time points without (T1, T2C, and T3C) or with (T2 and T3) Rs inoculation. B PCoA based on the weighted Unifrac distance. C Molecular ecological co-occurrence networks of the resistant and susceptible cultivars with or without Rs inoculation. Each node represents a genus, and the taxonomic information is denoted by the corresponding color shown in the legend. The size of each node is proportional to its degree of connection. The red and green edges represent the positive and negative interactions, respectively

