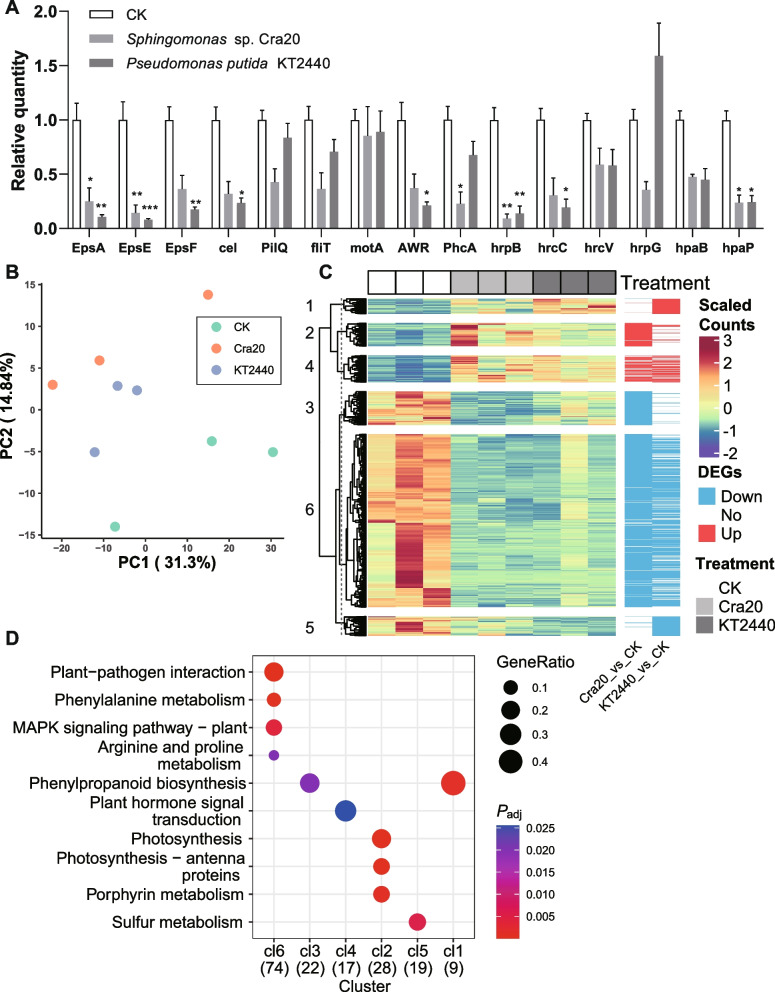
Fig. 8.
Various aspects involved in the resistance against Rs. A Effects of Cra20 and KT2440 on the expression of Rs GMI1000 virulence genes. EPSs-related genes: EpsA, EpsE, and EpsF. Drug-proton antiporter gene: cel. Motility-related genes: pilQ, fliT, and motA. T3SS-related genes: AWR, PhcA, hrpB, hrcC, hrcV, hrpG, hapB, and hpaP. The relative absolute abundances of these genes were normalized to that of the 16S rRNA gene. The relative quantity of each gene was normalized to the control. Each bar height indicates the mean abundance of a gene, and each error bar indicates standard error of mean (n = 4). The significance level was calculated using two-way ANOVA with Turkey correction (*P < 0.05; **P < 0.01; ***P < 0.001). B PCA plot based on the top 500 genes ordered by FPKM. C Heatmap of the DEGs. D Bubble plot of KEGG functional enrichment. The numbers in parentheses indicate the total number of DEGs with KEGG annotations. GeneRatio indicates the ratio of DEGs in a pathway to the total number of DEGs with KEGG annotations in the cluster

