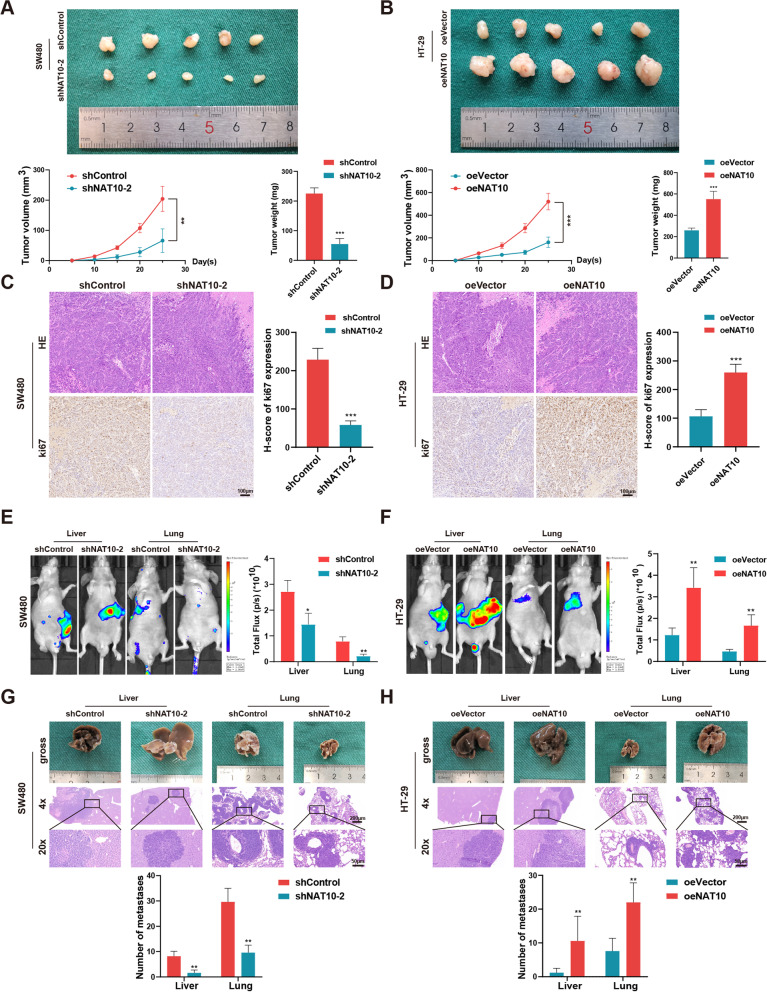
Fig. 3.
NAT10 facilitates tumor growth and metastasis in vivo. A and B Representative images of subcutaneous xenograft tumors (n = 5 for each group). The tumor volumes were measured every 5 days and the tumor weights were analyzed. C and D HE and IHC staining of xenograft tumors. The expression of Ki67 was detected by IHC. E and F Representative images and analysis of luminescence intensity in metastasis models (n = 5 for each group). G and H Representative image and HE staining of metastatic tumors in the livers and lungs of mice. The number of metastases in livers or lungs was analyzed. All data are presented as mean ± SD. *P < 0.05, **P < 0.01, ***P < 0.001

