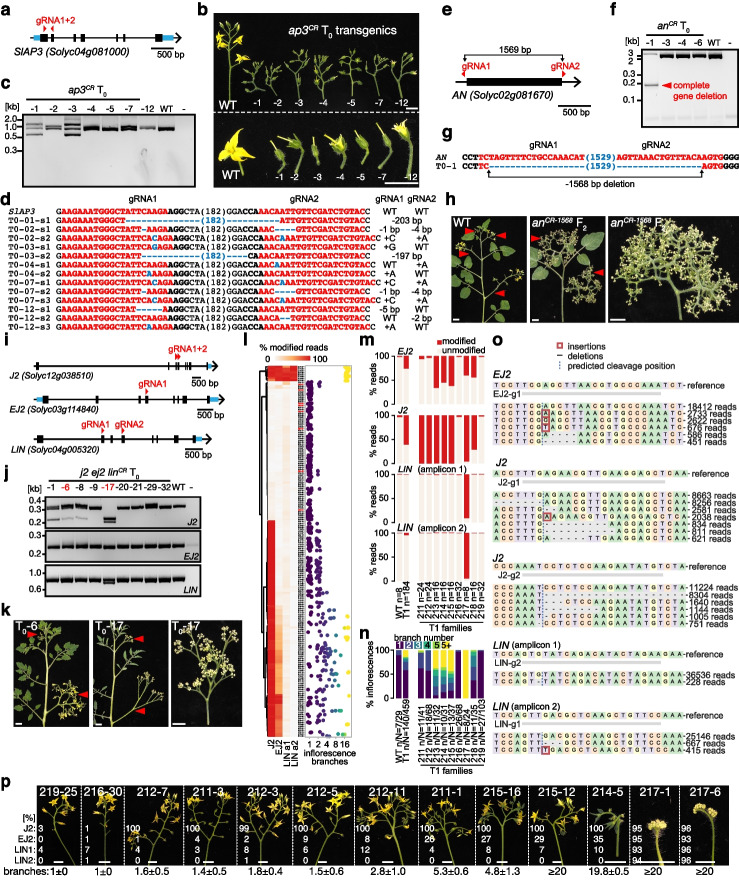
Fig. 2.
Sweet-100 is an effective system for genome editing experiments. a CRISPR-Cas9 targeting of SlAP3 using two gRNAs. Black boxes, black lines, and blue boxes represent exonic, intronic, and untranslated regions, respectively. b Images of detached inflorescences (top) and flowers (bottom) from wild-type (WT) and seven independent first-generation (T0) ap3CR transgenic plants. c and d CRISPR-induced mutations in SlAP3 identified by agarose gels (c) and Sanger sequencing (d). gRNA and PAM sequences are indicated in red and black bold letters, respectively; deletions are indicated with blue dashes; sequence gap length is given in parenthesis. e Full gene deletion of AN by CRISPR-Cas9 using two gRNAs. f and g, Detection of complete deletion of the AN gene by agarose gel electrophoresis (f) and Sanger sequencing (g). h Images of WT and anCR mutant plants in the non-transgenic second (F2) generation. i CRISPR-Cas9 targeting of the SEP4 gene family using five gRNAs. j analysis of j2CRej2CRlinCR T0 plants by agarose gel electrophoresis, k, images of T0 plants showing j2CRej2CR double (T0–6) and j2CRej2CRlinCR triple (T0–17) mutant phenotypes. l High-throughput discovery of CRISPR-Cas9 mutations in J2, EJ2, and LIN by multiplexed amplicon sequencing. Heatmap shows the percentage of modified reads in 184 T1 and 8 WT control plants. Red font indicates WT control individuals. Dotplot depicts the number of branches on 1 to 5 inflorescences per individual plant. m Percentage of modified reads in WT, all T1, and individual T1 families; n equals the number of individual plants. n Percentage of inflorescences with 1 to 5 or more branches on plants in (m); n and N equal the number of individual plants and inflorescences, respectively. o Sequences and frequency of edited alleles identified from in the T1 generation. p Images of detached inflorescences from individual plants from (l); percentage of modified reads (%) and number of inflorescence branches (mean ± s.d.) are indicated. Scale bars indicate 1 cm

