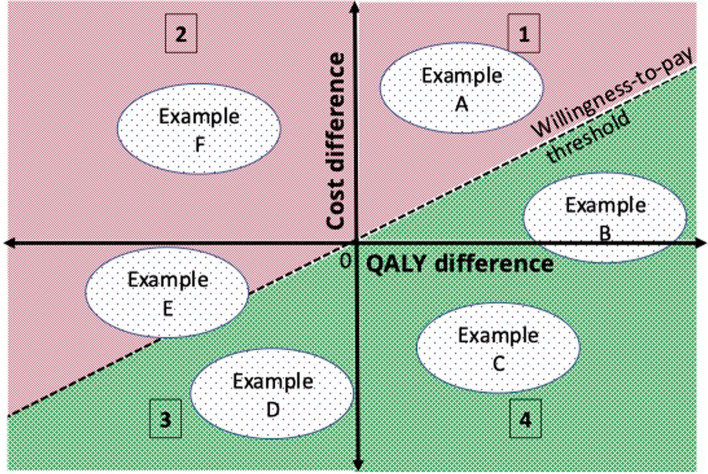
Fig. 2.
The cost-effectiveness plane and how to interpret it. Notes: The cost effectiveness plane has 2 axes that illustrate the incremental difference between the intervention group(s) and the comparator group. Difference in effects (typically in QALYs) on the x axis, and difference in costs on the y axis. Quadrant 1: costs more, and greater effects; Quadrant 2: costs more and is less effective (dominated); Quadrant 3: lower costs, but less effective; Quadrant 4: lower costs and greater effects (dominant). Example A: not cost-effective, because the cost-effectiveness is greater than the willingness-to-pay threshold; Example B: is cost-effective, because despite higher costs, it is lower than the willingness-to-pay threshold; Example C: a no-brainer – gets superior effects at lower costs; Example D: is cost-effective if you’re willing to accept inferior effects to save costs; Example E: is not cost-effective, because despite lower costs the inferior effects are above the threshold tolerable (but with some uncertainty, as the uncertainty interval, indicated by the outer cloud, crosses the WTP threshold); Example F: Fail. More costly and less effective. Also a no-brainer

