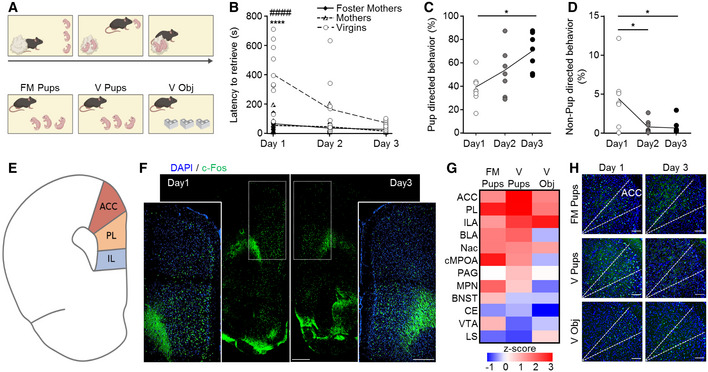
Figure 1. Dynamics of experience‐dependent parental behavior in virgin female mice and corresponding neuronal activity patterns.

-
ASchematic representation of the pup retrieval test.
-
BTotal pup retrieval time in biological mothers (n = 6), foster mothers (n = 7), and virgin females (n = 10) on 3 consecutive days. Data were analyzed using mixed‐model ANOVA with repeated measures and are displayed as mean ± s.e.m.; ****significantly different from foster mothers, P < 0.0001; ####significantly different from mothers, P < 0.0001.
-
C, DFraction of pup‐directed (C) and non‐pup‐directed (D) behaviors of virgin females of the total session duration in each of the 3 pup exposure days (n = 7). Data were analyzed using two‐way ANOVA with repeated measures and are displayed as individual measurements with the line connecting the mean value; *P < 0.05.
-
ESchematic representation of a coronal section showing regions of the medial prefrontal cortex (mPFC).
-
FRepresentative image of a coronal brain section immunostained for c‐Fos after pup retrieval on day 1 and 3. The mPFC region is indicated by dashed lines, which are also shown in the insets in higher magnification. The scale bar indicates 500 μm, 10× magnification.
-
GHeat‐map of the Z‐score for the difference in the fraction of c‐Fos‐expressing cells, between day 1 and 3 of behavioral testing. Foster mothers (FM Pups; n = 5), virgins with pups (V Pups; n = 6), and virgins with object (V Obj; n = 7).
-
HRepresentative coronal sections of the mPFC immunostained for c‐Fos with the anatomical borders of the ACC indicated by dashed lines, in the 3 groups described in (G) on day 1 and 3 of behavioral testing. Scale bar 100 μm, 20× magnification.
Source data are available online for this figure.
