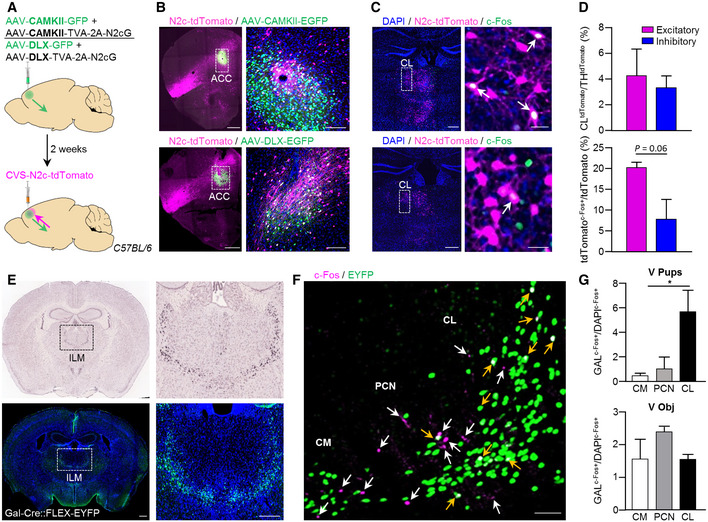
Figure 3. Functional and molecular properties of the CL‐ACC projection.

- Schematic representation of the dual anterograde and retrograde tracing scheme for quantification of differential thalamic input to excitatory/inhibitory neurons in ACC.
- Representative coronal sections of the PFC, following the labeling schemes described in (A), for mapping inputs onto ACC excitatory (B, top) and inhibitory (B, bottom) neurons. High‐magnification images (B, right top and bottom) show the double‐labeled, putative starter cells for transsynaptic retrograde labeling. Scale bars represent 200 μm, 10× magnification (left top and bottom), and 50 μm (right top and bottom), 20× magnification.
- Representative coronal images of the thalamus, immunolabeled for c‐Fos, following retrograde labeling from excitatory (C, top) or inhibitory (C, bottom) neurons in the ACC. White arrows in high‐magnification images indicate co‐localization of c‐Fos and td‐Tomato (C, right top and bottom). Scale bars represent 200 μm, 10× magnification (left top and bottom), and 25 μm (right top and bottom), 20× magnification.
- Quantification of the number of neurons in CL region projecting to excitatory or inhibitory ACC neurons, as a fraction of the total thalamic contribution (top) and a fraction of neurons co‐expressing tdTomato and c‐Fos of the total tdTomato+ population in CL (bottom). Foster mothers (n = 3), virgins with pups (n = 4), and virgins with object (n = 4). Data were analyzed using Student's t‐test and are displayed as mean ± s.e.m.
- Representative in situ hybridization images of Gal in the ILM taken from the Allen Mouse Brain Atlas, https://mouse.brain‐map.org/experiment/ivt?id=70231997 (top left and right) and representative coronal images showing the expression of Gal neurons in Gal‐Cre::FLEX‐YFP female mice (bottom right and left). Scale bars represent 500 μm, 10× magnification (left bottom) and 200 μm (right bottom).
- Representative image of the ILM immunolabeled for GFP and c‐Fos, following pup retrieval test. Yellow and white arrows indicate c‐Fos‐expressing Gal‐positive and Gal‐negative neurons, respectively. Scale bars represent 100 μm, 20× magnification.
- Graph plots showing the fraction of c‐Fos‐expressing Gal‐positive neurons in the CL, PCN, and CM after pup retrieval test (G, top, n = 3) or object exposure (G, bottom, n = 2). Data were analyzed using two‐way ANOVA and expressed as mean ± s.e.m.; *P < 0.05.
Source data are available online for this figure.
