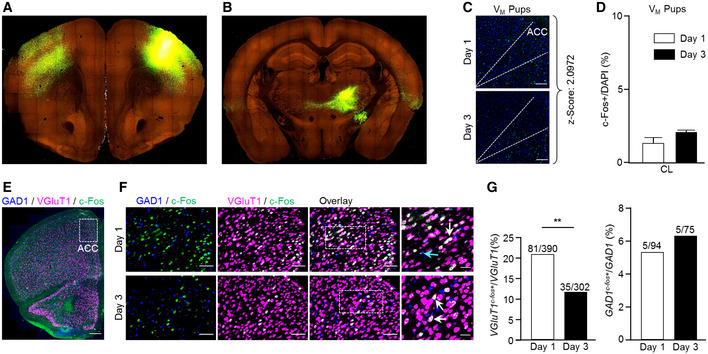
Figure EV3. Projections from the primary motor cortex to CM and PCN.

-
A, BRepresentative coronal images from the Allen Mouse Brain Connectivity Atlas (https://connectivity.brain‐map.org/projection/experiment/100141780?imageId=102152345), following anterograde labeling with AAV‐GFP in the primary motor cortex showing site of injection (A) and axonal distribution pattern in CM and PCN (B).
-
CRepresentative coronal sections of the mPFC immunostained for c‐Fos with the anatomical borders of the ACC indicated by dashed lines, in virgin male mice on day 1 and 3 of behavioral testing. Scale bar 100 μm, 20× magnification. Z‐score for the difference in the fraction of c‐Fos‐expressing cells, between day 1 and 3 of behavioral testing.
-
DFraction of c‐Fos+ cells in the CL central lateral nucleus in virgin male mice exposed to pups, on day 1 and 3 of behavioral testing (Day 1: n = 4, Day3: n = 3). Data were analyzed using Student's t‐test and are expressed as mean ± s.e.m.
-
E, FA representative image of the PFC of a virgin female following initial pup exposure showing mRNA expression patterns of slc17a7 (VGluT1), gad1 (GAD1), and c‐fos (c‐Fos) together with high‐magnification images of the ACC, following the 1st and 3rd days of pup‐exposure. The scale bars 500 μm, 10× magnification (A), and 100 μm, 20× magnification (B).
-
GA comparison of the fraction of excitatory and inhibitory c‐Fos+ cells, of the total VGluT1 and GAD1 cell population in the ACC, following the 1st and 3rd pup exposure days; data were analyzed using Fisher's exact test; **P < 0.01.
Source data are available online for this figure.
