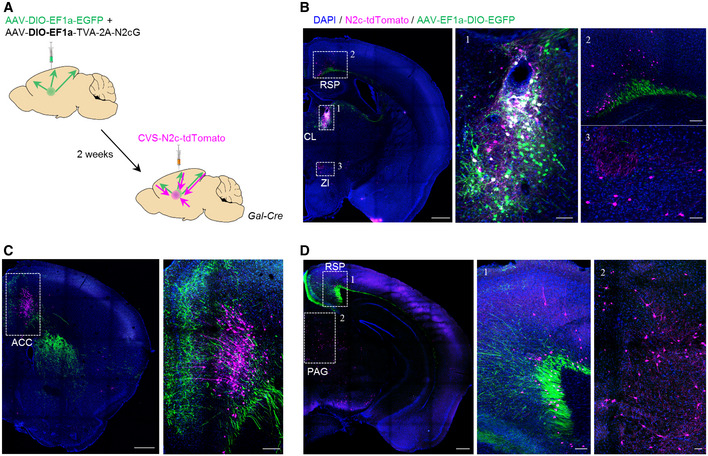
Figure 4. Tracing of CLGal neuronal connectivity.

-
ASchematic representation of the dual anterograde and retrograde tracing experiments from and to CLGal neurons.
-
BRepresentative images demonstrating specific targeting of the CL in Gal‐Cre mice, for dual anterograde (green) and retrograde (magenta) tracing. Scale bars represent 200 μm, 10× magnification. Expanded images to the right show the CLGal neurons (B‐1) and monosynaptic input neurons in the anterior RSP (B‐2) and ZI (B‐3). Scale bars represent 100 μm, 20× magnification.
-
C, DRepresentative images showing bidirectional connectivity with CLGal in the ACC (C) and the posterior RSP (D‐1) and input from the PAG (D‐2). Scale bars represent 200 μm, 10× magnification (left), and 100 μm, 20× magnification (middle and right, 1,2).
