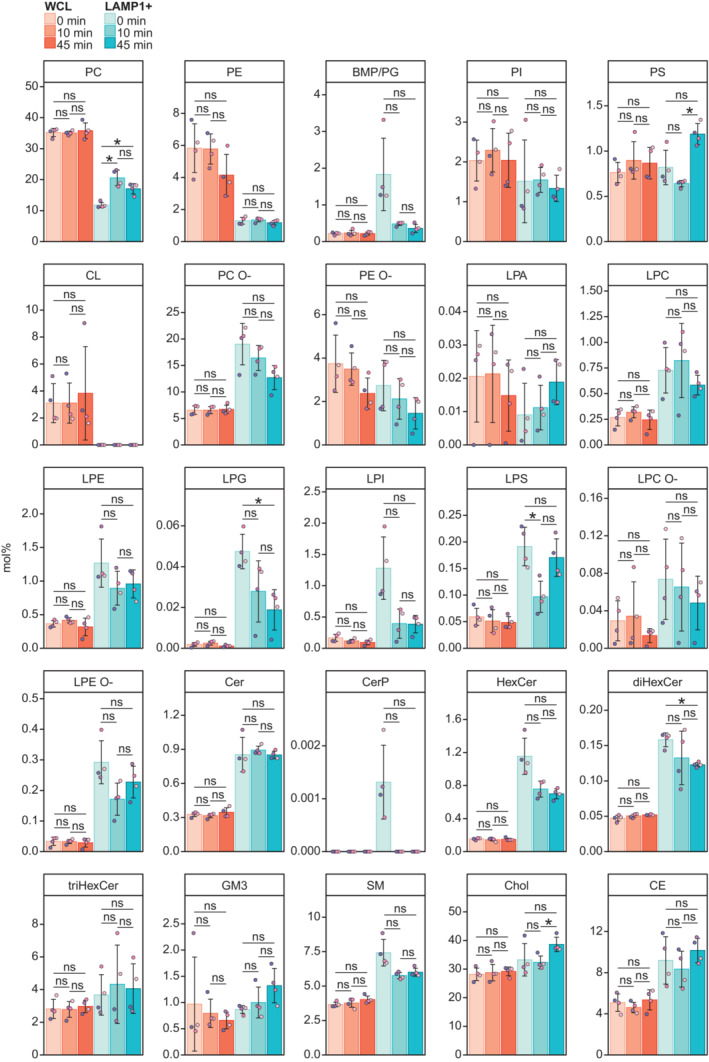
Figure EV2. Mol% of lipid classes in whole‐cell lysates (WCL) and purified lysosomes (LAMP1+ fractions).

Mol% of all monitored lipid classes in the WCLs and LAMP1+ fractions from cells untreated or treated with LLOMe for 10 or 45 min.
Data information: Bars and error bars denote mean ± SD from n = 3–4 independently performed purifications. Multiple t‐tests were performed to assess changes between means. Resultant P‐values were corrected for multiple testing using Benjamini–Hochberg correction and differences were considered statistically significantly changed with adjusted P‐values (q‐values) of 0.05 or less. *q < 0.05. Abbreviations are as in Fig 1.
