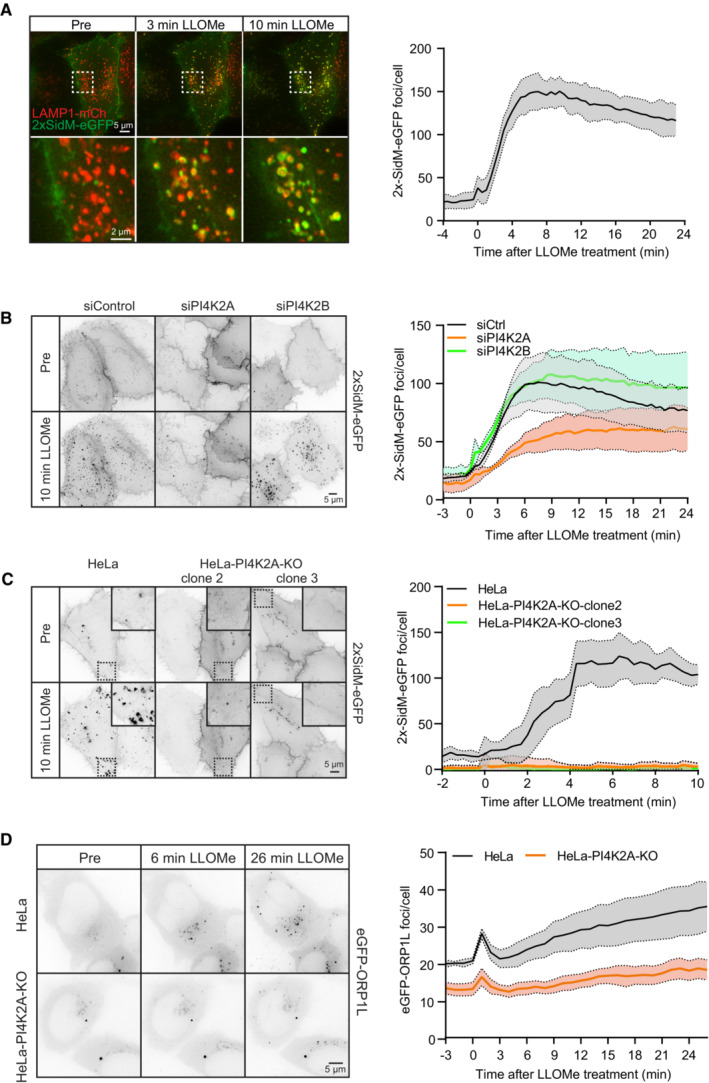
Figure 3. ORP1L is recruited by PI4K2A‐dependent accumulation of PtdIns4P on damaged lysosomes.

- Movie stills from a live‐cell imaging experiment showing rapid 2xSidM‐eGFP recruitment to damaged lysosomes upon 250‐μM LLOMe treatment (indicated in green). Lysosomes were visualized using transiently overexpressed LAMP1‐mCherry (indicated in red). Yellow spots show colocalized PtdIns4P probe (2xSidM‐eGFP) and LAMP1‐mCherry after 3 and 10 min of LLOMe treatment. The graph shows the quantification of 2xSidM‐eGFP foci per cell after LLOMe treatment. Error bars denote ± SEM from n = 3 independent live‐cell imaging experiments, > 20 cells were analyzed per experiment.
- HeLa cells were transfected with control siRNA or siRNA targeting PI4K2A or PI4K2B for 48 h (KD efficiency is shown in Fig EV5C) and transiently transfected with the 2xSidM‐eGFP probe to monitor PtdIns4P recruitment after LLOMe treatment by live‐cell imaging. Representative movie stills show the dynamics of 2xSidM‐eGFP recruitment in control, PI4K2A, and PI4K2B depleted cells. The graph represents the quantification of 2xSidM‐eGFP foci per cell after LLOMe treatment. Error bars denote ± SEM from n = 3 independent live‐cell imaging experiments, > 25 cells were analyzed per experiment for each condition.
- CRISPR‐Cas9‐mediated knockout of PI4K2A abolishes recruitment of the 2xSidM‐eGFP probe (PtdIns4P) to damaged lysosomes. Two different clones (clone 2 and clone 3) were tested. The graph represents the quantification of 2xSidM‐eGFP foci per cell after LLOMe treatment. Error bars denote ± SD from n = 2 independent live‐cell imaging experiments, > 20 cells were analyzed per experiment for each condition.
- Representative movie stills from live fluorescence microscopy showing reduced eGFP‐ORP1L recruitment in PI4K2A knockout cells compared to wild‐type HeLa cells upon treatment with 250‐μM LLOMe. The graph represents the quantification of eGFP‐ORP1L foci per cell after LLOMe treatment. Error bars denote ± SEM from n = 4 independent live‐cell imaging experiments, > 80 cells were analyzed per experiment for each condition.
