
Figure 6. Cholesterol accumulation on damaged lysosomes depends on PI4K2A, VAPA/B, and ORP1L.
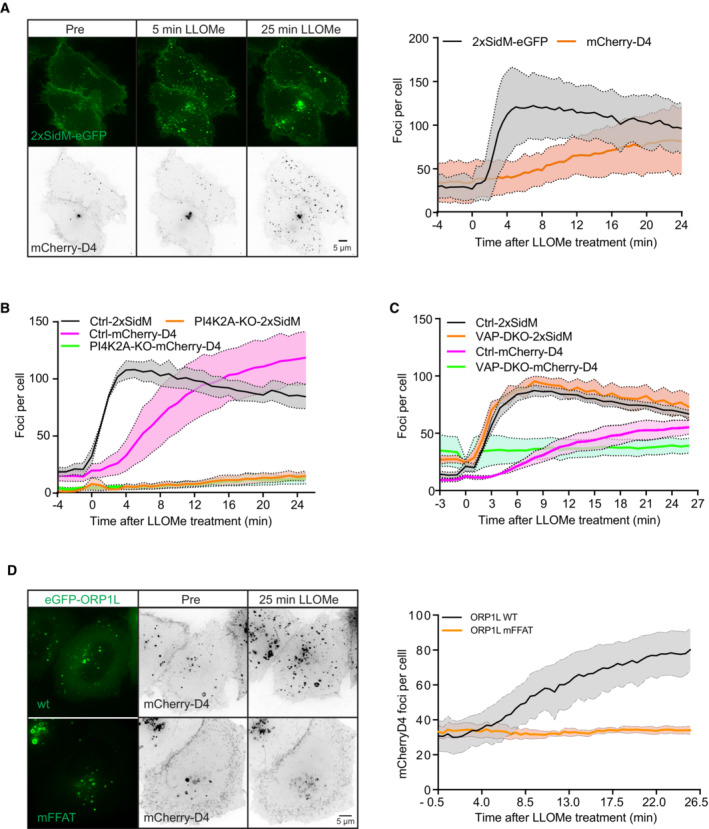
- Representative movie stills of a live‐cell imaging experiment illustrate faster recruitment of the PtdIns4P probe 2xSidM‐eGFP to damaged lysosomes when compared to cholesterol as indicated by the mCherry‐D4 probe. The graph shows the quantification of 2xSidM‐eGFP and mCherry‐D4 foci per cell. Error bars denote ± SD from n = 2 independent live‐cell imaging experiments, > 26 cells were analyzed per experiment for each condition.
- Graph showing quantification of mCherry‐D4 and 2xSidM‐eGFP foci per cell in parental HeLa cells (Ctrl) and PI4K2A knockout cells (PI4K2A‐KO). Error bars correspond to ± SEM from n = 3 independent experiments, > 30 cells per condition were analyzed.
- Quantification graph of 2xSidM‐eGFP and mCherry‐D4 foci per cell in HeLa and VAP double knockout cells. Error bars denote ± SEM from n = 3 independent experiments, > 30 cells per condition were analyzed.
- HeLa cells expressing an eGFP‐tagged ORP1L mutant incapable of binding to VAP (mFFAT) show no accumulation of the cholesterol reporter mCherry‐D4 upon lysosomal damage induced with 250‐μM LLOMe when compared to wild‐type (wt) eGFP‐ORP1L. The quantification graph shows D4‐mCherry foci per cell. Error bars denote ± SEM from n = 4 independent live‐cell imaging experiments, > 50 cells were analyzed per experiment for each condition.