
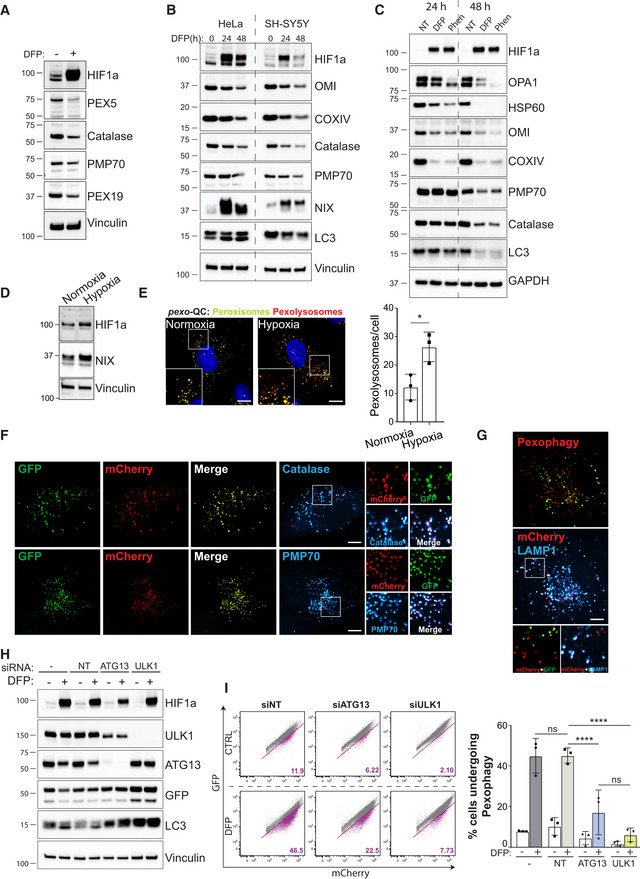
Figure EV1. Analysis of pexophagy upon iron chelation and hypoxia.
-
ARepresentative immunoblots of the indicated proteins in lysates of ARPE‐19 cells treated 48 h with 1 mM DFP.
-
B, CRepresentative immunoblots of the indicated proteins in lysates of HeLa and SH‐SY5Y cells (B) or ARPE‐19 cells (C), treated with 1 mM DFP or 50 μM Phenentroline (Phen) for the indicated time (h).
-
DRepresentative immunoblots of the indicated proteins in lysates of ARPE‐19 cells stimulated with hypoxia (0.8%) for 3 days.
-
ERepresentative confocal images of ARPE‐19 cells stably expressing the pexo‐QC reporter stimulated with hypoxia (0.8%) for 3 days and at right, quantification of total red‐only punctate per cell (pexolysosomes). Enlarged images of the area outlined in white are shown in the lower corners.
-
F, GRepresentative confocal images of ARPE‐19 cells stably expressing the pexo‐QC reporter treated with 1 mM DFP for 48 h and immunostained with peroxisomal markers (F, Catalase and PMP70), or lysosomal marker (G, LAMP1). Enlarged images of the area outlined in white are shown on the right or below.
-
H, IARPE‐19 cells expressing the pexo‐QC reporter were transfected with 50 pmol of non‐targeting siRNA (siNT) or 50 pmol of siRNA targeting ATG13 or ULK1. 48 h post transfection, cells were treated with 1 mM DFP for an additional 48 h and analysed by immunoblot (H) or by flow cytometry (I). Representative dot plots are shown after analysing GFP and mCherry signals. The percentage of cell underdoing pexophagy (purple population) is indicated in bold purple on each dot plot.
Data information: Overall data are mean ± s.d.; n = 3 biological replicates. *P ≤ 0.05; ****P ≤ 0.0001; ns, not significant (two‐way ANOVA, Sidak's multiple comparisons test). Nuclei were stained in blue (Hoechst) and scale bars: 10 μm.
Source data are available online for this figure.