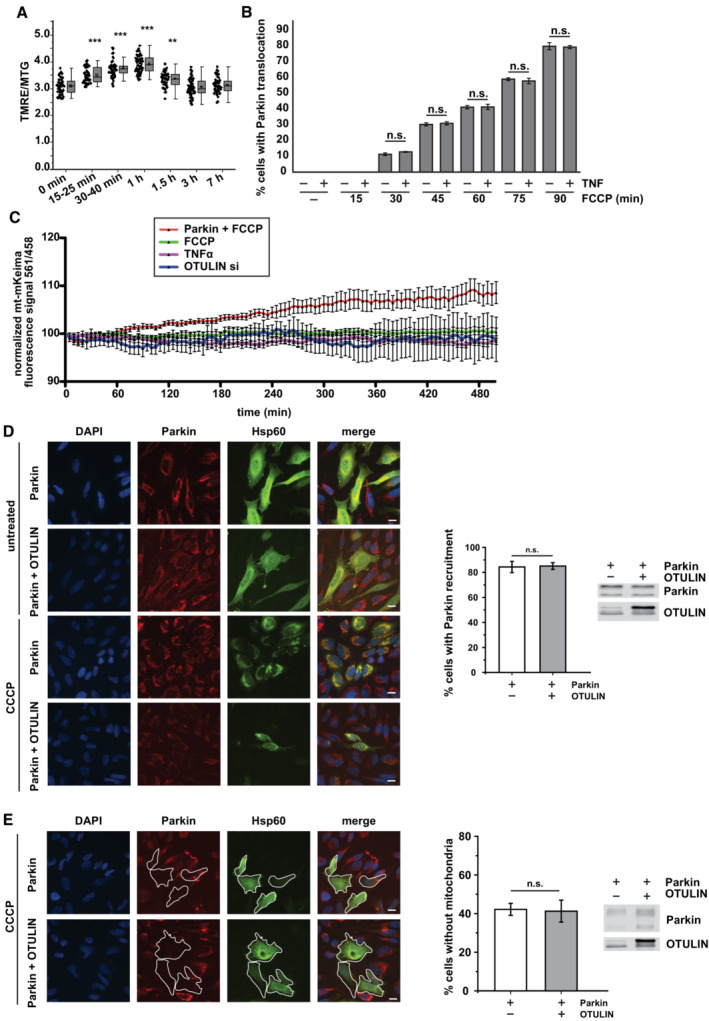
TNF‐induced PINK1 stabilization is not associated with a decrease in the mitochondrial membrane potential. HeLa cells were treated with TNF (25 ng/ml, 15 min) and the mitochondrial membrane potential was assessed by the fluorescence signal intensity ratio of TMRE and MitoTracker™ Green (MTG), One‐way ANOVA, n = 2 (technical replicates). Each point presents the data from one cell (biological replicate). Box‐and Whiskers plots: The error bars denote the standard deviation (SD), and the boxes represent the 25th to 75th percentiles. Whiskers: outliers not included. The vertical lines in the boxes represent the median values, whereas the square symbols in the boxes denote the respective mean values. Significance: **P ≤ 0.01; ***P ≤ 0.001.
TNF does not affect FCCP‐induced translocation of Parkin to mitochondria. HeLa cells transiently expressing Parkin were treated with FCCP (10 μM) for the indicated time with or without a TNF pretreatment (25 ng/ml for 15 min). Then, the cells were fixed and analyzed by immunocytochemistry and fluorescence microscopy using Parkin and Hsp60 antibodies. Shown is the mean ± standard deviation (student's t‐test) based on three independent experiments; at least 300 cells per condition were assessed.
Neither TNF treatment nor OTULIN silencing increases mitophagy. SH‐SY5Y cells were treated as indicated: Parkin overexpression plus FCCP 10 μM (red), FCCP 10 μM only (green), TNF 25 ng/ml (purple), or OTULIN silencing for 48 h (blue). A ratiometric analysis of fluorescence intensities was performed at the time indicated by live‐cell microscopy in cells transiently expressing mt‐mKeima. Shown are the mean normalized fluorescence intensities ± standard deviation measured every 5 min over 500 min. At least five cells were monitored for each condition.
OTULIN does not affect CCCP‐induced translocation of Parkin to mitochondria. HeLa cells transiently expressing Parkin or Parkin and OTULIN were treated with CCCP (10 μM) for 90 min. Then, untreated and CCCP‐treated cells were fixed and analyzed by immunocytochemistry and fluorescence microscopy using Parkin and Hsp60 antibodies. Middle panel: Quantification of mitochondrial Parkin translocation. Shown is the mean ± standard deviation (student's t‐test) based on three independent experiments. Right panel: Expression controls. Scale bar: 10 μm.
OTULIN does not affect CCCP‐induced PINK1/Parkin‐dependent mitophagy. HeLa cells transiently expressing Parkin or Parkin and OTULIN were treated with CCCP (10 μM) for 24 h. Then, the cells were fixed and analyzed by immunocytochemistry and fluorescence microscopy using Parkin and Hsp60 antibodies. Middle panel: Quantification of mitochondrial clearance. Shown is the mean ± standard deviation (student's t‐test) based on three independent experiments; at least 300 cells per condition were assessed. Right panel: Expression controls. Scale bar: 10 μm.

