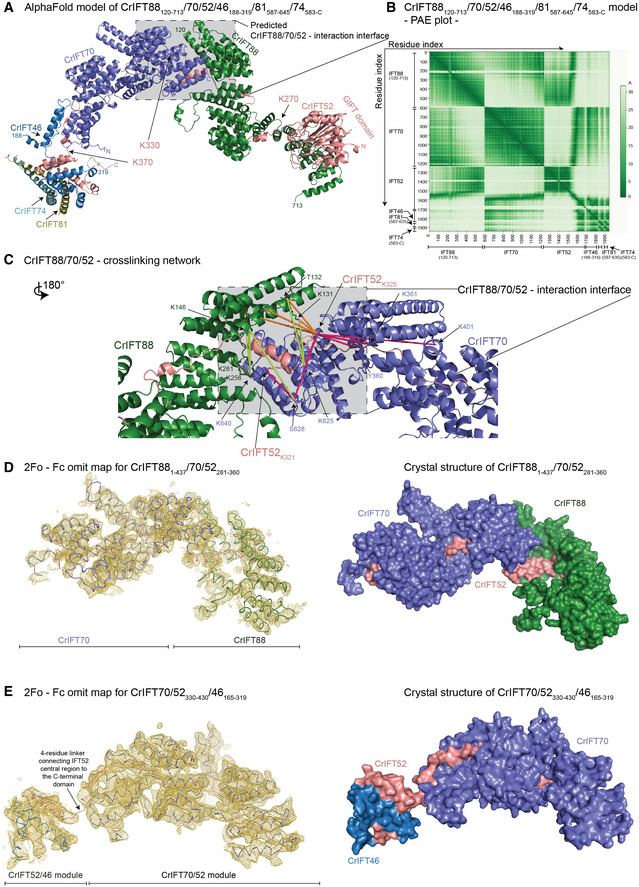
Figure 3. Structural model of the IFT88/70/52/46 IFT‐B1 subcomplex.

- The AlphaFold predicted model of CrIFT88120–713/70/52/46188–319/81587–645/74583‐C.
- The predicted alignment error plot of the complex from A. The residue indexes are indicated on the X‐ and Y‐axis.
- The CrIFT88/70/52 cross‐linking network validates the interaction interface predicted by AlphaFold. The lime‐green dashed lines are showing cross‐linking pairs formed between IFT88 and IFT70. The orange dashed lines are showing the IFT88/52 cross‐links and the pink lines are showing the cross‐links between IFT52 and IFT70. K321 and K325 of IFT52 make multiple short‐range interactions with both IFT88 and IFT70 residues.
- The crystal structure of Chlamydomonas IFT881–437/70/52281–360 displayed as ribbon and the 2Fo ‐ Fc omit map (3sigma) as a yellow mesh (left panel). Surface representation of the structure is shown on right panel.
- The crystal structure of Chlamydomonas IFT70/52330–430/46165–319 displayed as ribbon and the 2Fo ‐ Fc omit map (3sigma) as a yellow mesh (left panel). Surface representation of the structure is shown on right panel.
