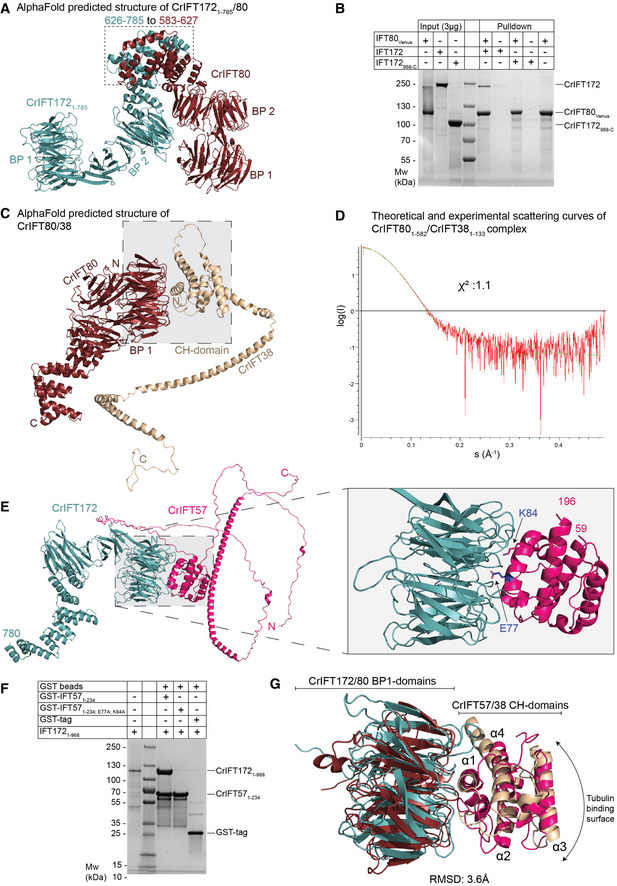
Figure 6. Dissecting the interaction between IFT80, IFT172, IFT57, and IFT38.

- AphaFold predicted structure of IFT1721–785/80.
- Pull‐down experiments with purified IFT80Venus immobilized on GFP‐binder beads and either IFT172 or IFT172968‐C. IFT80 pulls down full‐length IFT172 but not the truncated version lacking the N‐terminal 967 residues.
- AlphaFold predicted structure of IFT80 in complex with IFT38 maps the interaction at the interface between the BP1 of IFT80 and the CH‐domain of IFT38.
- Comparison of the solution X‐ray scattering curve of CrIFT80/38 as measured by SAXS and the calculated scattering curve for the IFT80/38 structural prediction. A χ2 value of close to 1 indicate an excellent fit between measurement and calculation.
- AlphaFold predicted structure of CrIFT172 and CrIFT57 shows interaction via the BP1 and CH domains. On the right panel, two residues in the CH‐domain of IFT57, which are located at the interface with IFT172, are highlighted.
- GST tagged CrIFT1721–968 pulls down the CH‐domain of CrIFT571–234 but not the mutated CH‐domain of CrIFT57 where E77 and K84 residues were replaced by alanines.
- Superimposition of the structure of BP1 of CrIFT80 (colored in red ruby) in complex with the CH‐domain of 38 (colored in beige) with the BP1/CH domains of CrIFT172/57 (colored in teal and hot pink, respectively) shows a conserved mechanism of interaction different from the canonical tubulin binding mode exhibited by CH domains.
