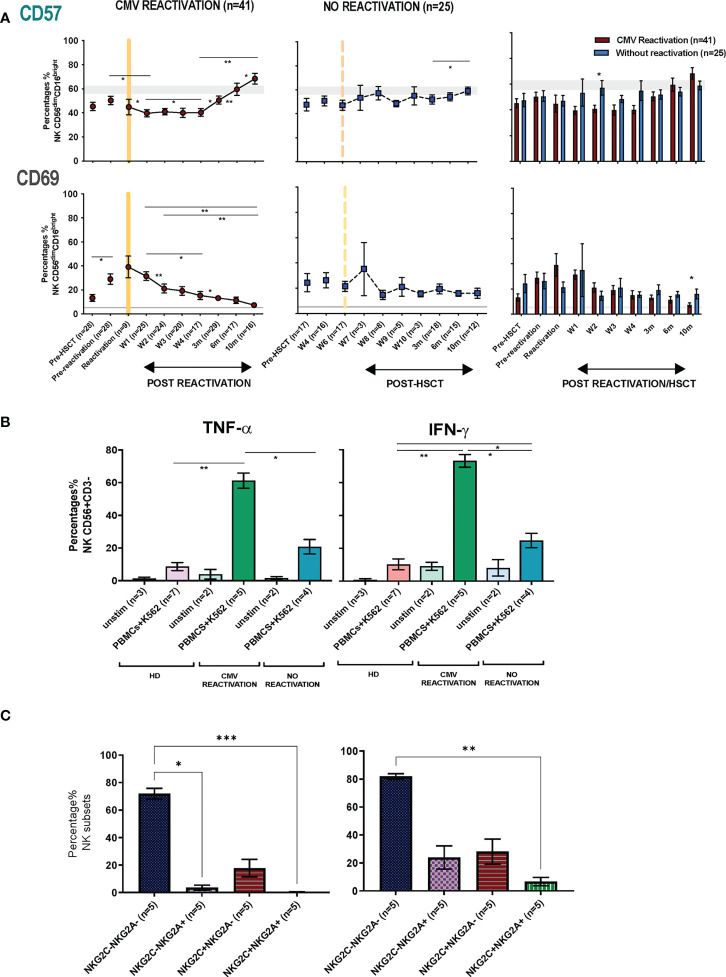
Figure 5.
NK cells from HSCT patients who have undergone an episode of CMV reactivation demonstrate early proliferation with subsequent maturation and enhanced production of cytokines. (A) The percentage of CD57+ and CD69+ on NK cells from patients following CMV reactivation (purple line and bar) or without CMV reactivation (blue line and bar). Grey lines represent the range of CD57+ and CD69+ NK cells in healthy controls. (*p<0.05, **p<0.01, ***P<0.001; Wilcoxon sign rank test for matched phenotypes). (B) Enhanced TNF-α (left panel) and IFN-γ (right panel) production from NK cells of HSCT patients following prior CMV reactivation. Data are shown as percentage of cytokine-positive NK cells following K562 stimulation. (*p<0.05**p<0.01; Anova test). (C) TNF-α (left panel) and IFN-γ (right panel) production from four NK subsets (NKG2A-/NKG2C-, NKG2A+/NKG2C-, NKG2A-/NKG2C+, NKG2A+/NKG2C+) in patients following prior CMV reactivation. Data are shown as percentage of cytokine-positive NK subsets following K562 stimulation. (*p<0.05**p<0.01***p<0.001; Anova test).

