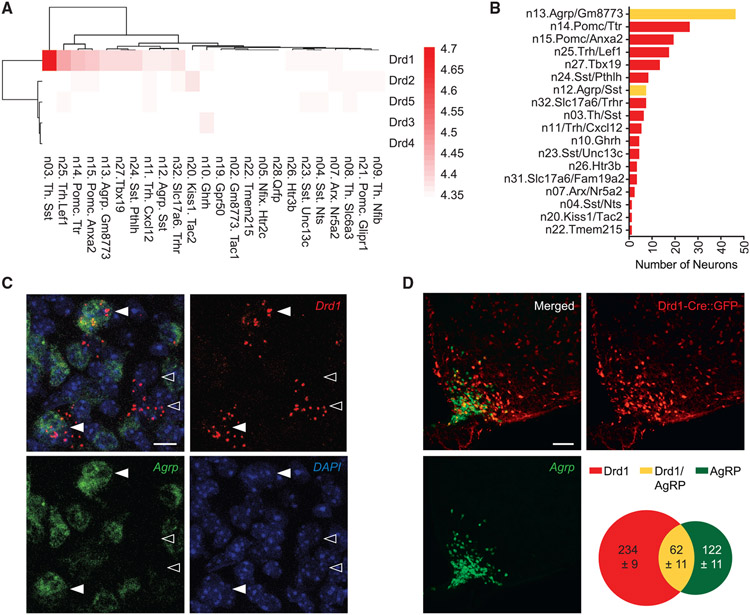
Figure 1. The genetic profile of ARC neurons reveals an orexigenic neuronal population expressing Drd1.
(A) Batch-corrected, normalized expression values for Drd genes in each arcuate-median eminence (ARC-ME) neuron cluster from the Campbell et al., 2017 dataset.
(B) Number of Drd1 positive neurons from each cluster of ARC-ME neurons from A. Drd1 positive neurons from Agrp-expressing clusters are depicted in yellow.
(C) RNAscope images showing representative Drd1-expressing cells in the ARC with (▸) or without (▹) Agrp expression. Scale bar, 10 μm.
(D) Representative images showing the ARC of Drd1-Cre:GFP mice. Scale bar, 100 μm. Venn diagram indicates the average number of cells expressing only the Drd1-Cre:GFP (red), only Agrp (green), and both Drd1-Cre:GFP and Agrp (yellow). n = 3.

