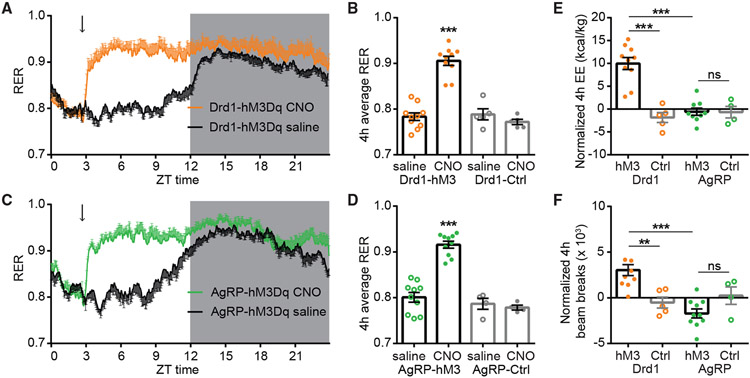
Figure 4. ARCDrd1 neurons regulate energy homeostasis.
(A and C) A 24-h RER in Drd1-hM3Dq (A) or AgRP-hM3Dq mice (C) after saline (black traces) or CNO administration (orange and green traces, respectively). The dark portion of the light cycle is indicated by gray shading. Arrows indicate the time of injections.
(B) Average 4-h RER in Drd1-hM3Dq and control mice after saline or CNO administration. Repeated-measures two-way ANOVA with Bonferroni post hoc comparison; n = 5–10/group; Ftransgene (1, 13) = 48.61, p < 0.001; Ftreatment (1, 13) = 21.21, p < 0.001.
(D) Average 4-h RER AgRP-hM3Dq and control mice following saline or CNO administration. Repeated-measures two-way ANOVA with Bonferroni post hoc comparison; n = 4–10/group; Ftransgene (1, 12) = 60.55, p < 0.001; Ftreatment (1, 12) = 17.85, p = 0.0012.
(E) Normalized 4-h EE in Drd1-hM3Dq, AgRP-hM3Dq, or control mice. Responses were normalized by subtracting the EE after saline injections. Two-way ANOVA with Bonferroni post hoc comparison; n = 4–10/group; Fgenotype (1, 24) = 13.11, p = 0.0014; Ftransgene (1, 24) = 21.19, p < 0.001.
(F) Normalized 4-h beam breaks in Drd1-hM3Dq, AgRP-hM3Dq, or control mice. Responses were normalized by subtracting the beam breaks after saline injections. Two-way ANOVA with Bonferroni post hoc comparison; n = 4–10/group; Fgenotype (1, 25) = 8.372, p = 0.0078; Ftransgene (1, 25) = 1.353, p = 0.2557. Data are represented as mean ± standard error of the mean. *p < 0.05; **p < 0.01; ***p < 0.001.

