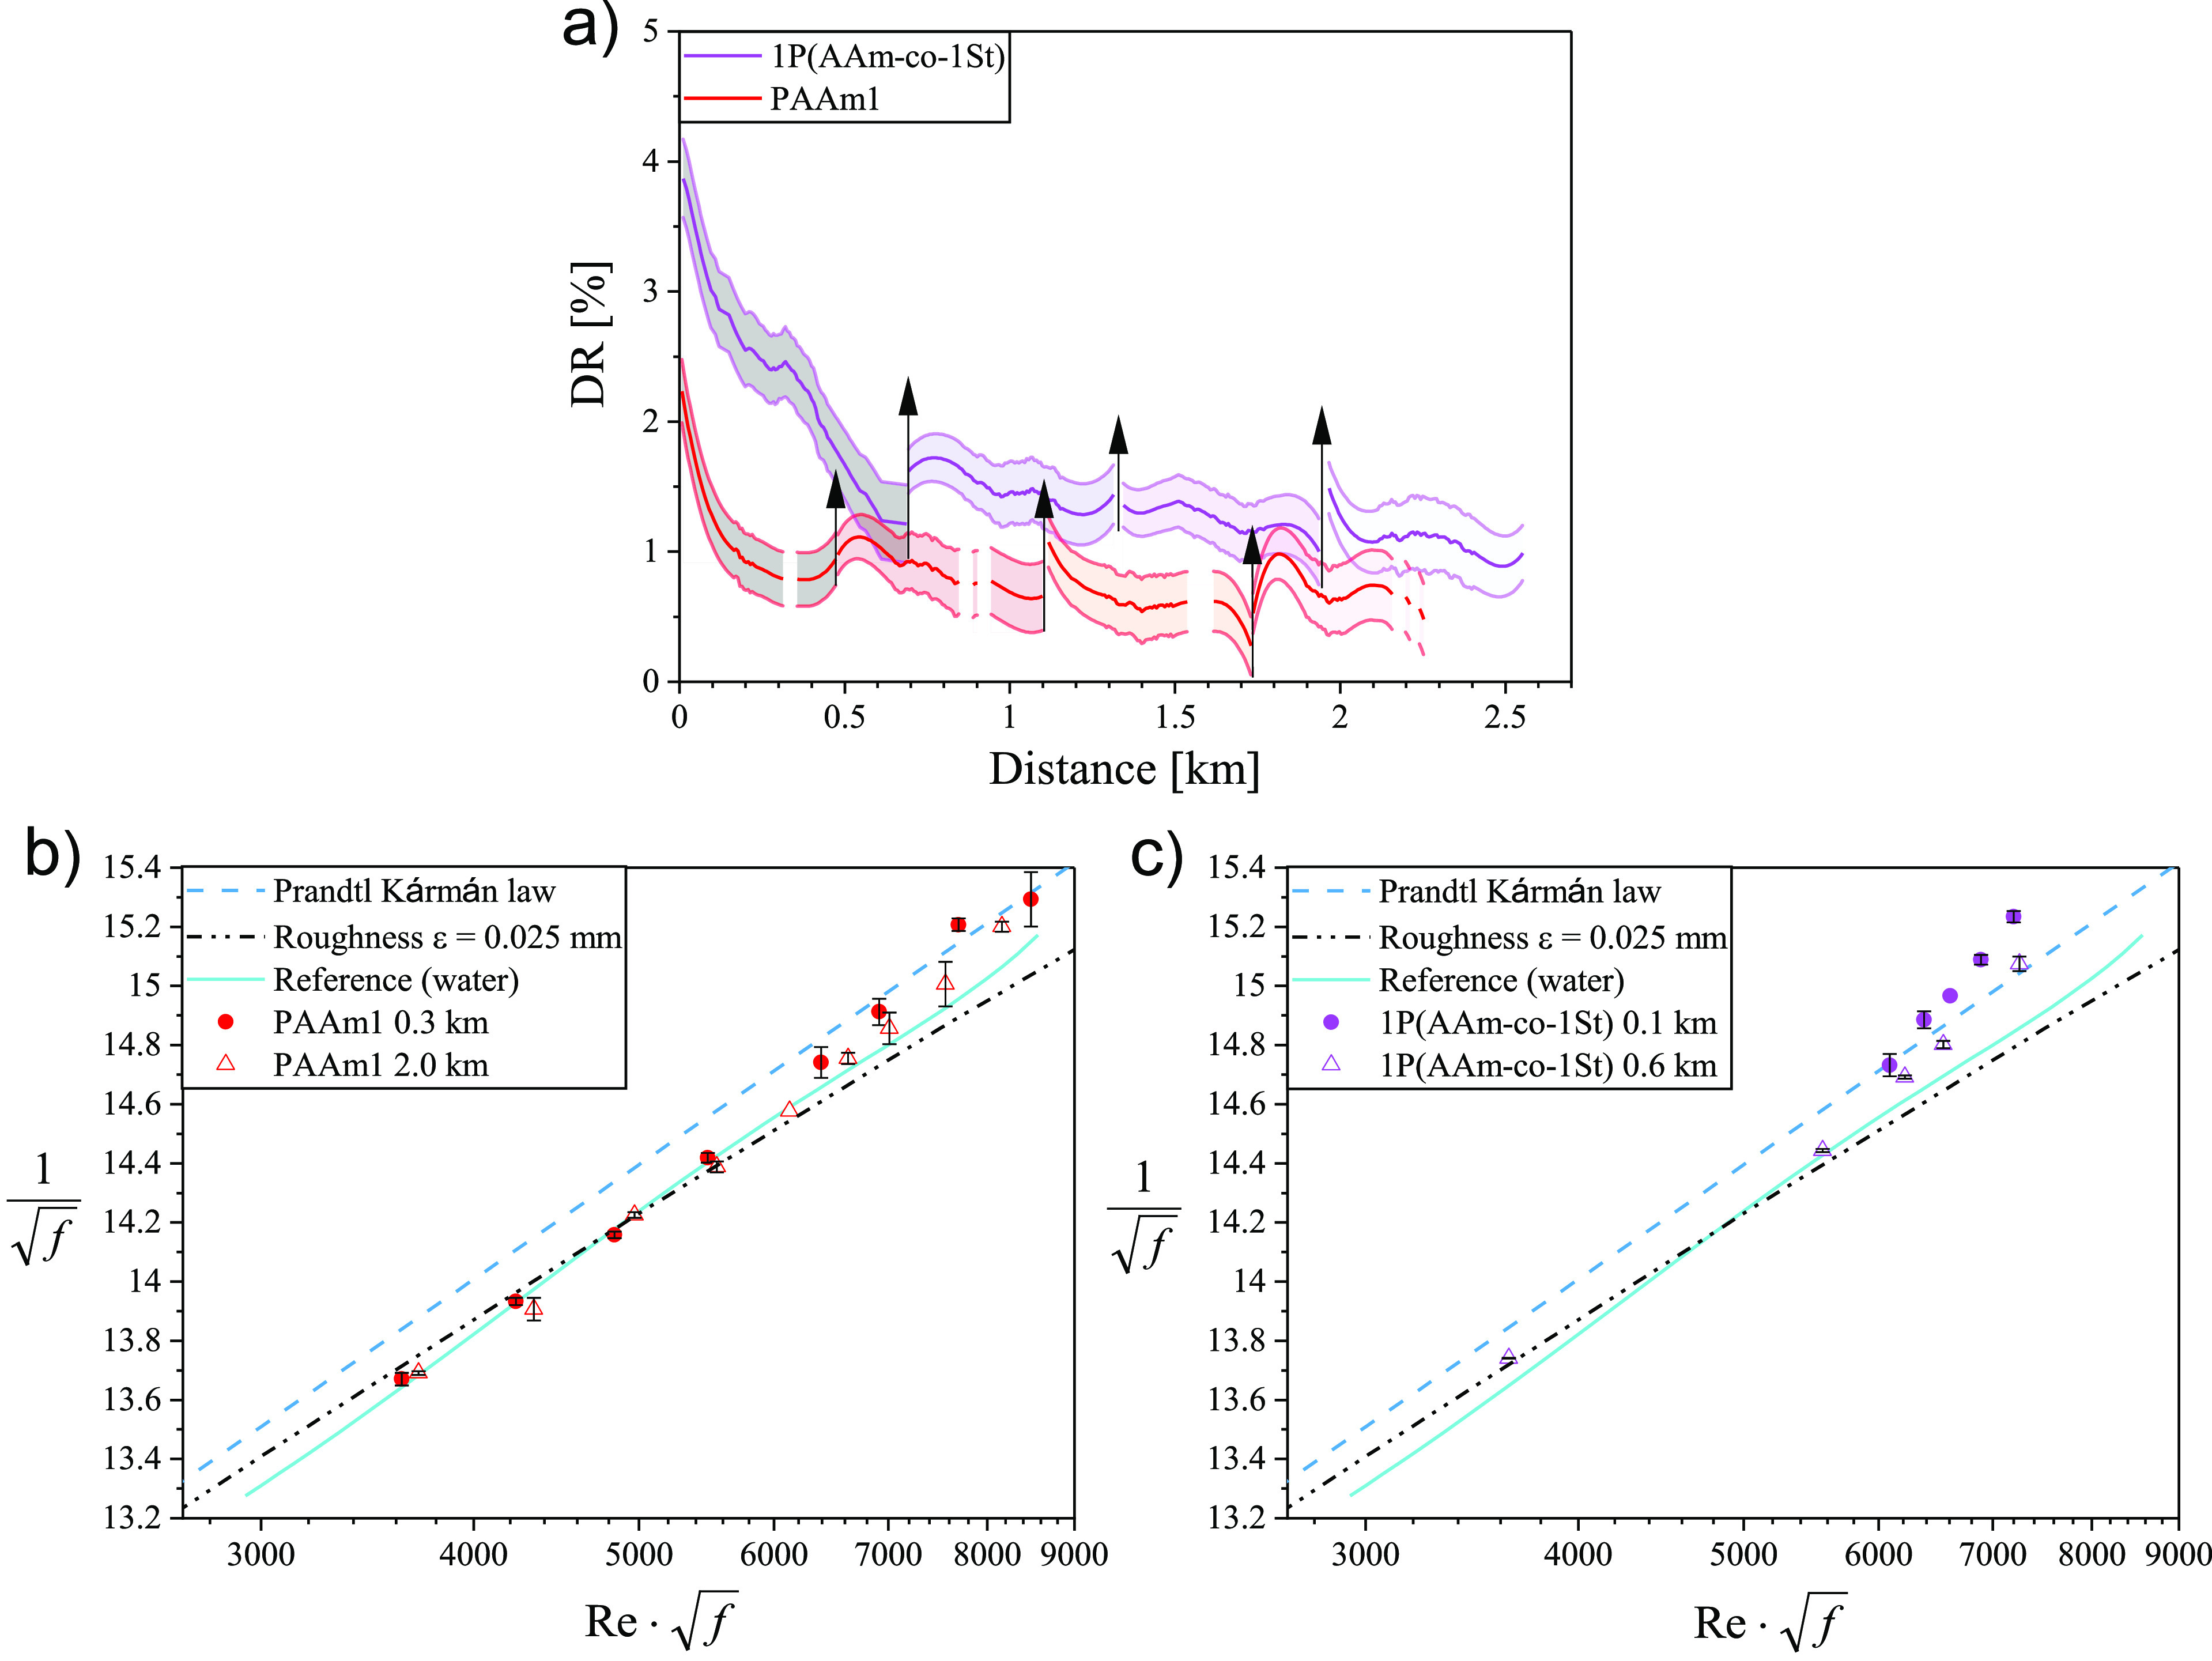
Figure 4.

(a) Drag reduction DR(%) of polymers Mw ≈ 1000 kg/mol as a function of distance traveled through the test section at constant polymer c = 0.01 wt % and Re = 100 000. The arrows pointing upward represent points of salt addition. Prandtl–Kármán plots for (b) PAAm1 after 0.3 and 2.0 km represented by closed and open symbols and (c) 1P(AAm-co-1St) 0.1 and 0.6 km illustrated by closed and open symbols.
