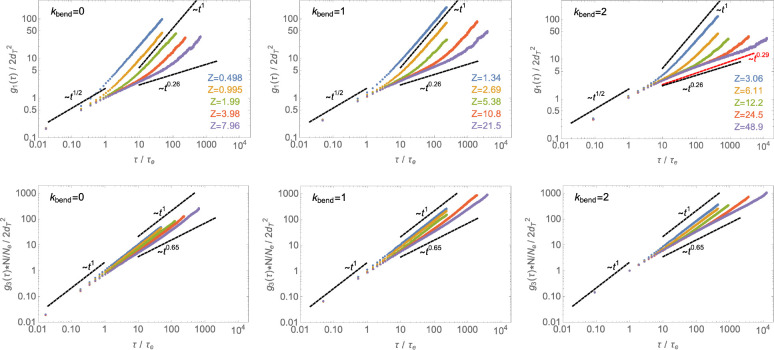
Figure 10.
Monomer time mean-square displacement, g1(τ) (eq 8), and chain center of mass time mean-square displacement, g3(τ) (eq 9). Symbols of the same color are for the same number of monomers N, and the corresponding number of entanglements Z per chain is indicated in the legends. The dashed black lines correspond to the dynamic predictions of the lattice tree model, eqs 10 and 11 with ν = 1/3 (eq 5) and ρ = 5/9 (eq 6). The dashed red line in the top-right panel corresponds to the theoretical prediction of the FLG model19 by Ge et al.

