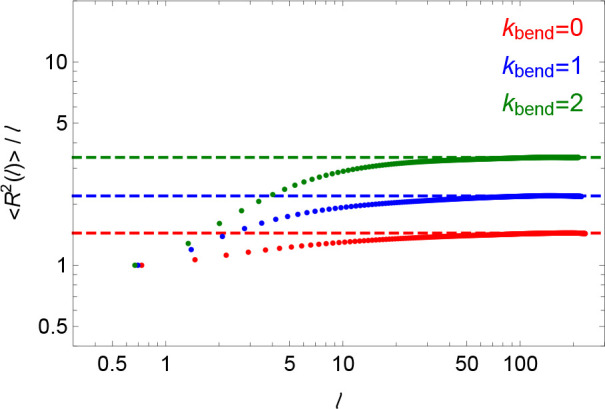
Figure 3.

(Symbols) Ratios of the mean-square end-to-end distance,
⟨R2( )⟩/
)⟩/ , to the corresponding
monomer contour length
separation
  for linear
chains in the melt and for the
different bending stiffness parameters κbend (see
legend). (Dashed lines) Best fits of the plateau-like behaviors on
the contour length interval
  ∈ [150,
200] (see eq 18 and
the text for details).
