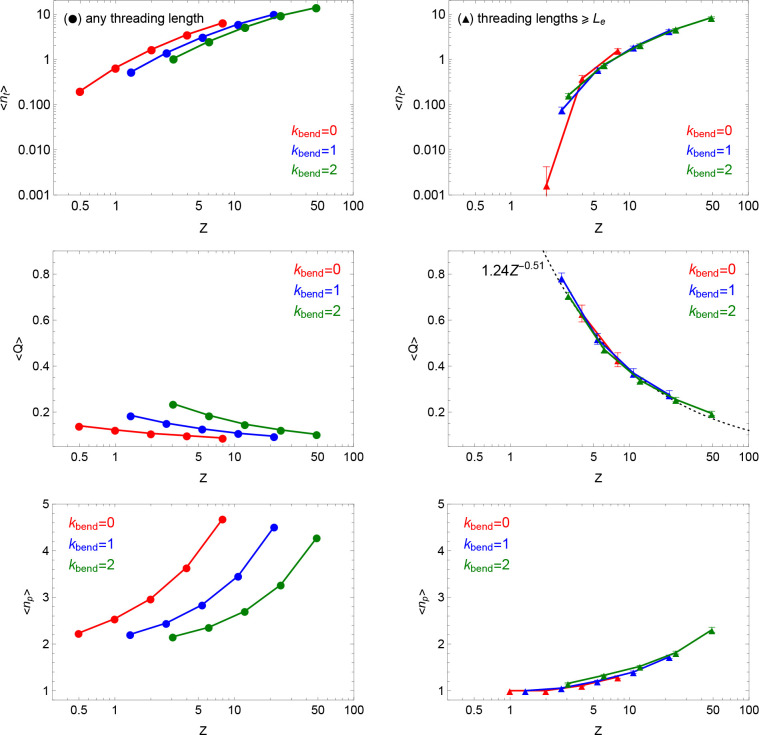
Figure 6.
Statistics of threadings by minimal surfaces as a function of the total number of entanglements, Z, of each ring in the melt. The data (circles) shown in the left-hand panels (respectively, (up-triangles) in the right-hand panels) have been obtained by including threading lengths Lt of any size (respectively, Lt ≥ Le). Error bars represent the error of the mean calculated from 100 uncorrelated snapshots. (Top) ⟨nt⟩: mean number of rings threaded by a single ring. (Middle) ⟨Q⟩: mean relative amount of contour length piercing one ring minimal surface side with respect to the other (eq 23). The dashed (black) line on the right-hand panel corresponds to the best fit to the data. (Bottom) ⟨np⟩: mean number of times a ring penetrates the minimal surface of any other single ring.

