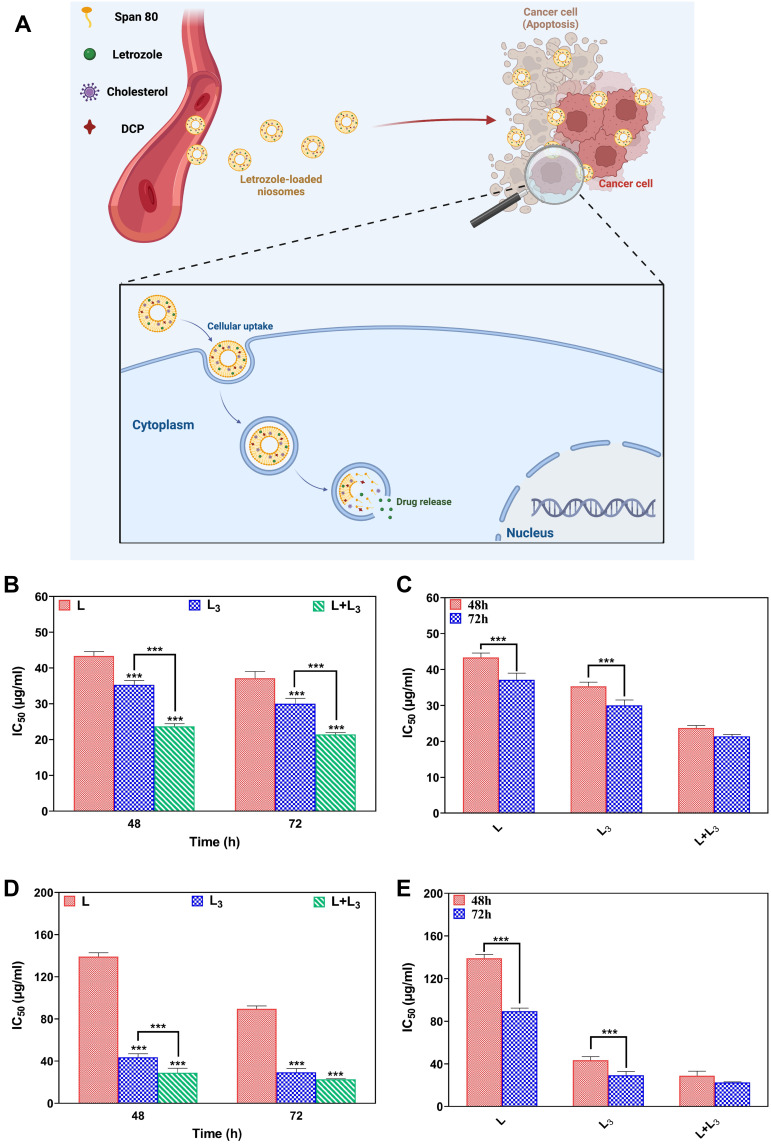
Figure 6.
Schematic of cytotoxicity assay of letrozole from a niosome (A); IC50 values for MCF-7 cells after 48 h and 72 h treatment (B); Comparison between IC50 values in the different formulations in the different time points for MCF-7 cells (C); IC50 values for MDA-MB-231 cells after 48 h and 72 h treatment (D); Comparison between IC50 values in the different formulations in the different time points for MDA-MB-23 cells (E). Data are represented as mean ± SD and n=3; P<0.001***.

