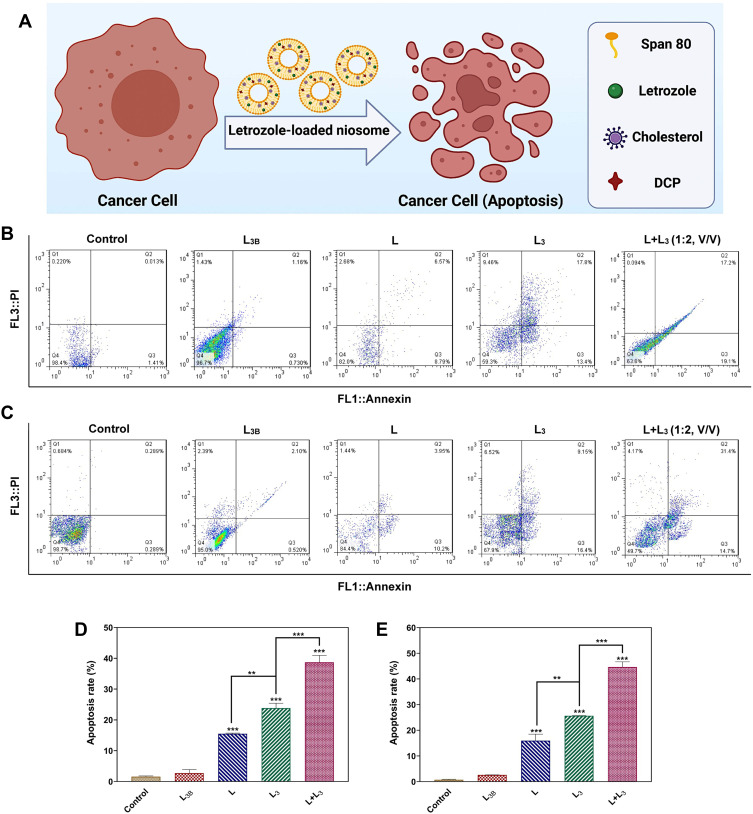
Figure 8.
(A) The apoptosis assay of the breast cancer cells treated by different formulations of letrozole; (B) The flow cytometry of MCF-7 and (C) MDA-MB-231 cells after treatment with different samples. Different quadrants in the scatter plot of double variable flow cytometry could reveal the following information: the Q1 quadrant (FITC−/PI+): necrotic cells; the Q2 quadrant (FITC+/PI+): late apoptotic cells; Q3 quadrant (FITC+/PI−): early apoptotic cells; and the Q4 quadrant (FITC−/PI−): living cells. Data are represented as mean ± SD. (D) The quantitative apoptosis rate analysis of MCF-7 cells and (E) MDA-MB-231 cells after treatment with different samples. Data are represented as mean ± SD and n=3; ***P<0.001, **P<0.01.

