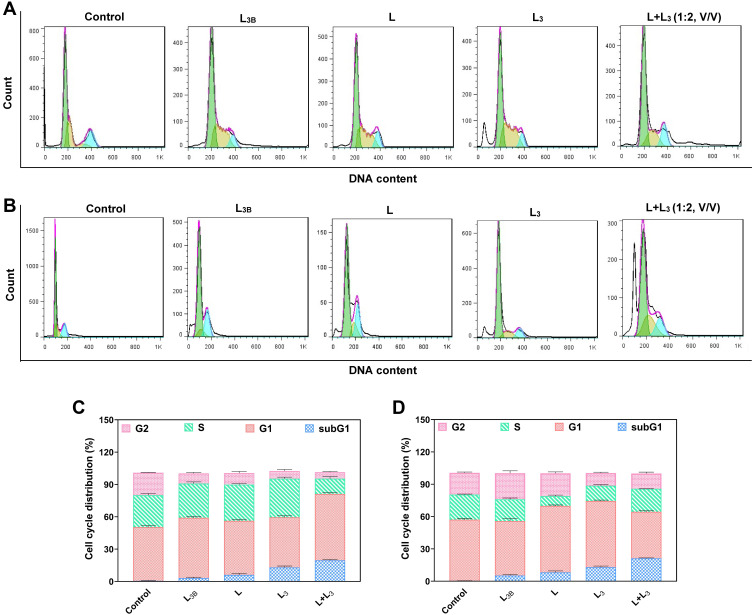
Figure 9.
(A) Cell cycle analysis of MCF-7 and (B) MDA-MB-231 cells treated by different formulations of niosomes by the same concentration of the drug. (C) Cell cycle distribution for MCF-7 cells and (D) MDA-MB-231 cells after treatment with different samples. The control sample refers to the cells without treatment with any drug or nanomaterial. Data are represented as mean ± SD.

