
FIGURE 2.
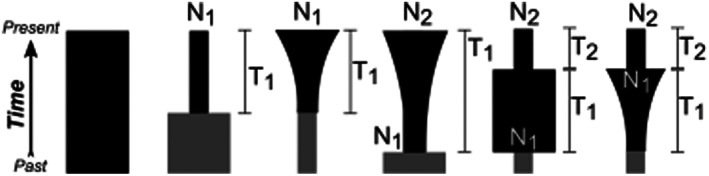
A visual of the demographic scenarios; (1) model 1 (N/a): Standard neutral model; (2) model 2 (N 1, T): A single, instant change; (3) model 3 (N 1, T): Gradual change; (4) model 4 (N 1, N 2, T 1): Instantaneous size change followed by gradual change; (5) model 5 (N 1, N 2, T 1, T 2): Two independent, instant changes; and model 6 (N 1, N 2, T 1, T 2): Gradual change followed by an exponential distribution. The magnitude of change is parameterized as N 1 and N 2 (size relative to ancestral population size, depicted in grey). Modified from Peart et al. (2020).