
FIGURE 2.
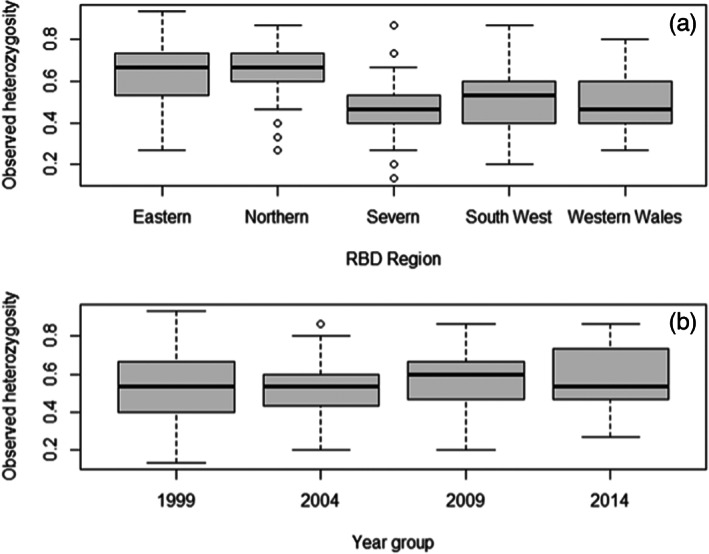
Boxplots showing variation in observed heterozygosity by RBD region and time. (a) Spatial variation by RBD region. Model results suggest significantly higher Ho in northern and eastern regions than in Severn South West and West Wales. Data shown exclude 1994 due to data deficiency across several regions; additionally, note that for South West region, there are no data for 1999. (b) Temporal variation by year (excluding 1994). Model results suggest no significant trend over time. In both plots, black lines indicate the median, grey boxes show the interquartile range, and whiskers show largest and smallest values excluding outliers, where outliers are defined as values that exceed 1.5 times the interquartile range and are shown as open circles.