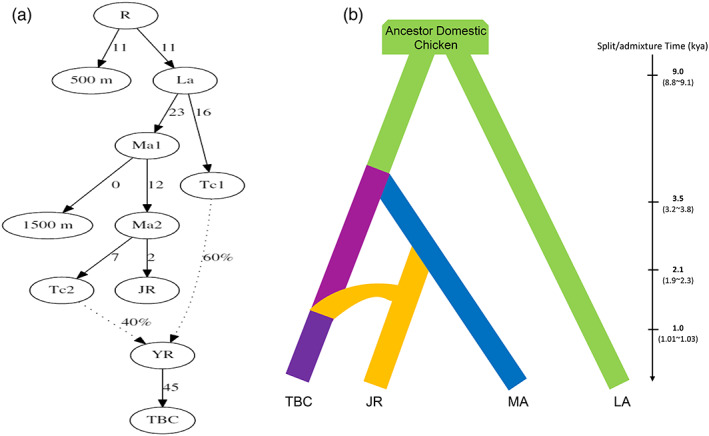
FIGURE 3.

Modeling the history of two subgroups of the high‐altitude chicken (HAC). (a) Best fit model inferred using the qpGraph program for chicken populations from “1500 m” (Zhaotong [ZT], Zhenyuan [ZY], Yimen [YM], and Wuliangshan [WLS]), “JR” (Lijiang [LJ] and Nixi [NX] near the Jinsha River), and “TBC” (Linzhi [LZ], Gongbujiangda [GB], and Shannan [SN] near the Yarlung Zangbo River), using the “500 m” (Chahua [CH], Banna game chicken [BG], and red jungle fowl [RJF]) population as the outgroup. The branch lengths are shown in units of F st × 1000. Dotted lines denote admixture events, and the values beside the dotted line correspond to admixture proportions. (b) Demographic history, including the divergence and migration times, for the Tibetan chicken (TBC), Jinsha River chicken (JR), middle‐altitude region chicken (MA), and low‐altitude area chicken (LA) inferred using the Fastsimcoal program.
