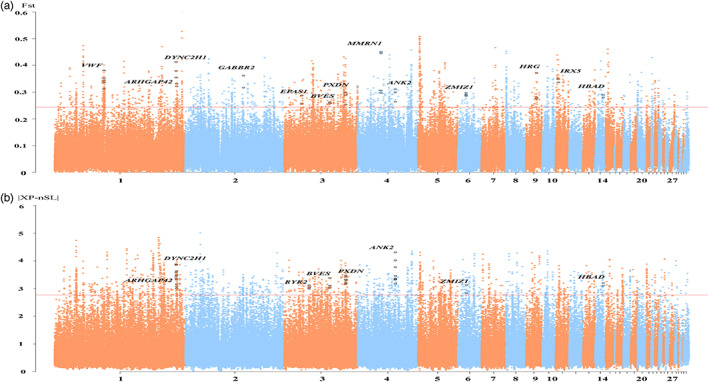
FIGURE 4.

Positive selection scans for adaptation to high altitude. Red line, selection criteria for each test; black dots, strongly selected windows or single‐nucleotide polymorphisms (SNPs). (a) F st value as calculated by comparing the TBC and “500 m” groups. (b) Normalized absolute XP‐nSL value is shown by comparing the TBC and “500 m” groups.
