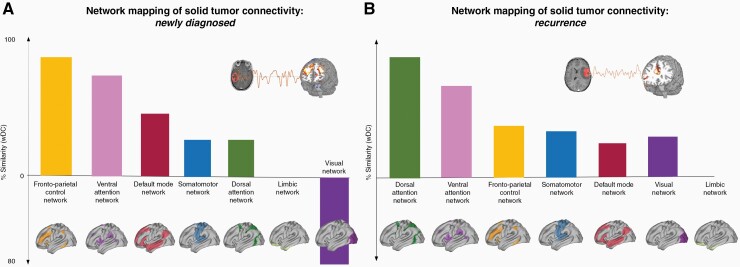
Figure 3.
Network mapping of solid tumor connectivity. Newly diagnosed (A) and recurrent glioma (B) functional connectivity profile revealed overlap with several networks, with a preference for distributed fronto-parietal networks such the FPCN, DAN and VAN. DAN, dorsal attention network; FPCN, fronto-parietal control network; VAN, ventral attention network, wDC, weighted dice coefficient.

