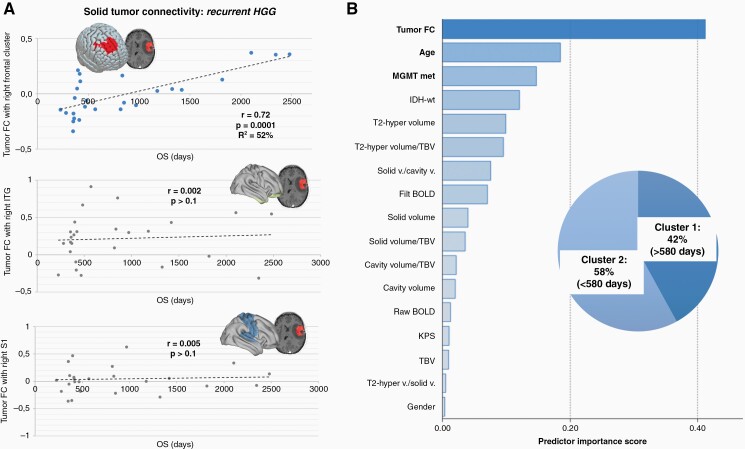
Figure 5.
Overall survival in recurrent HGG and patients’ classification. (A) In HGG at recurrence, a single cluster in the right frontal lobe showing FC with the tumor mass was found to significantly predict OS variability across patients. Connectivity with control regions located in right ITG and right S1 showed no significant link with OS (for additional control regions please see Supplementary Figure S2). Regression model parameters are reported in the Results section. (B) A clustering algorithm was used to classify recurrent HGG patients based on OS, producing two groups: (1) long-term survivor—Cluster 1, and (2) short term survivor—Cluster 2. Among available predictors, including clinical, molecular, demographic and radiological parameters (ie, volume of the T2-hyperintense region, solid part, IDH status; see Supplementary Table S2 and Figure S3), tumor functional connectivity resulted as the best predictor of OS. FC, functional connectivity; filt BOLD, filtered BOLD; IDH-wt, IDH-wild type; ITG, inferior temporal gyrus; KPS, Karnofsky Performance Status score; MGMT met, methylation status of MGMT promoter; OS, overall survival; S1, primary sensory cortex; T2-hyper, T2-hyperintense region; TBV, total brain volume; v., volume.

