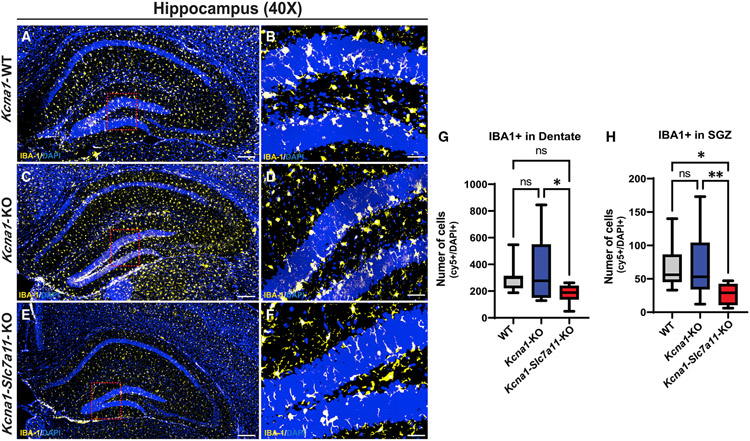
Figure 4. Microglia numbers are elevated in SVZ of the Kcna1-KO DG and strikingly absent in this zone in Kcna1-Slc7a11-KO mice.
(A–F) Representative images of higher power (40×) stitched images of whole hippocampi (A, C, and E) and single field of view (B, D, and F) in (A and B) Kcna1-WT (n = 3; 1 male/2 females, 12 stitched images), (C and D) Kcna1-KO (n = 3; 1 male/2 females, 12 stitched images), and (E and F) Kcna1-Slc7a11-KO (n = 3; 1 male/2 females, 12 stitched images) mice immunolabeled with anti-IBA-1 to mark microglia.
(G and H) Quantification of IBA-1+ microglia in the DG (G) and SGZ (H) of the GCL (HALO, Indica Labs).
Scale bars: 250 μm. Data are represented as mean ± SEM.

