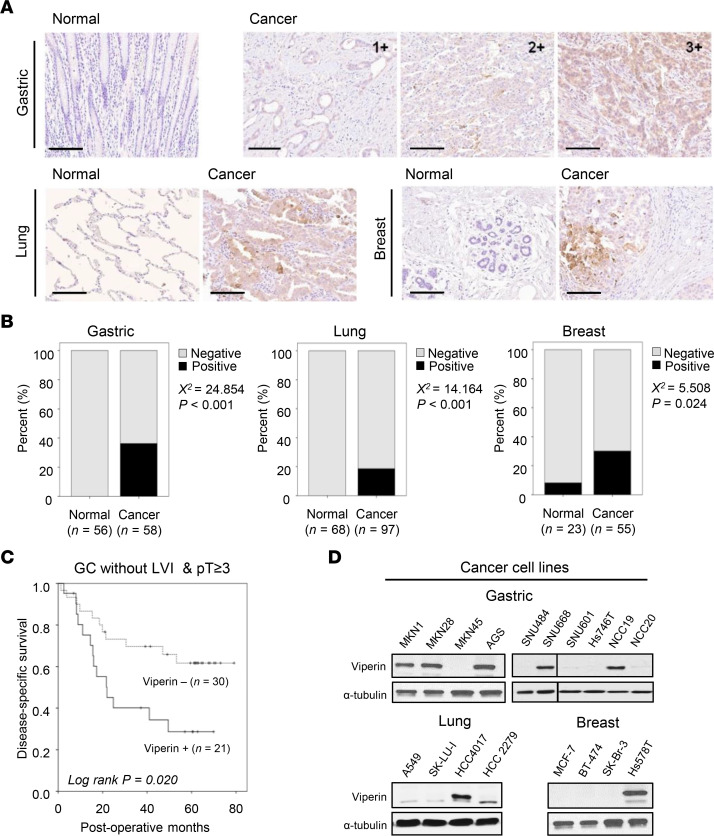
Figure 1. Viperin expression in human cancer tissues and its correlation with survival of patients with cancer.
(A and B) Viperin was specifically expressed in cancer tissues. (A) IHC analysis of viperin expression in human gastric (n = 114), lung (n = 165), and breast cancer (n = 78) tissues stained with a mAb against viperin (MaP.VIP). The paired adjacent noncancerous tissues were used for comparison against cancer tissues. A score of 1 was considered to represent mild expression, 2 as moderate expression, and 3 as marked expression. Scale bars: 100 μm. (B) Statistical analysis of viperin expression in cancer specimens. Pearson’s χ2 test and P values are shown for cancerous versus normal tissues. (C) Disease-specific survival of patients with gastric cancer (GC). In a subgroup (n = 51) of combined advanced-stage (pT ≥3) without lymphovascular invasion (LVI), patients with high expression of viperin had poor disease-free survival (Kaplan-Meier plot). A log-rank test (P = 0.020) was performed for patients with high and low expression of viperin. (D) Viperin expression in various cancer cell lines. Viperin protein was detected by immunoblotting using MaP.VIP. α-Tubulin was used as a loading control.

