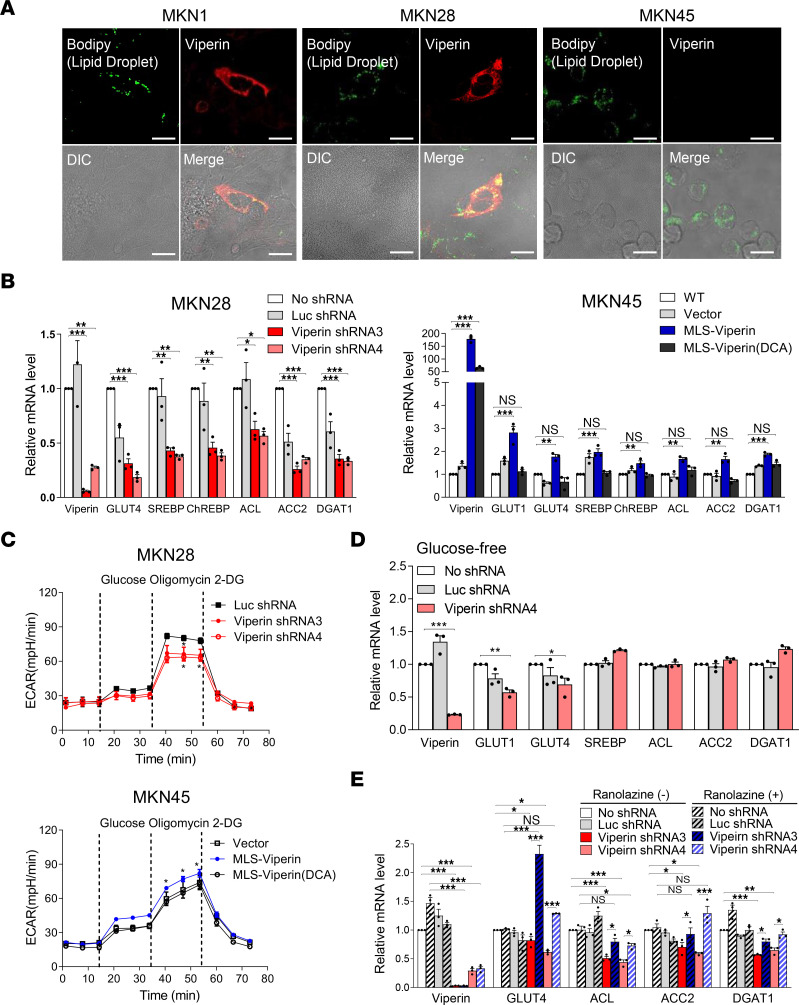
Figure 2. Viperin induces lipogenesis and glycolysis of cancer cells.
(A) Lipid accumulation in cancer cells expressing viperin. Gastric cancer cell lines expressing viperin (MKN1 and MKN28) and those not expressing viperin (MKN45) were stained with bodipy-FITC (green), an indicator of LDs, and MaP.VIP (red). Scale bars: 20 μm. (B) No shRNA, a control Luc shRNA, or viperin shRNAs were stably expressed in MKN28 cells, and a control vector, MLS-viperin, or MLS-viperin (DCA) was stably expressed in MKN45 cells. Relative mRNA levels of viperin, glucose transporters (GLUT1 and -4), major transcriptional regulators (SREBP and ChREBP), and key lipogenic enzymes (ACL, ACC2, and DGAT1) in the stable cell lines were measured by qRT-PCR and normalized to ACTB mRNA. Data are presented as the mean ± SEM (n = 3 in triplicate). MLS-viperin, the N-terminal amphipathic α-helix (residues 1 to 42) of viperin was deleted and replaced by MLSs (residues 2 to 34) of vMIA; MLS-Viperin (DCA), 2 cysteine residues (88 and 91) of MLS-viperin were mutated to alanine. (C) The ECAR was measured in the MKN28 and MKN45 stable cell lines. Glucose, oligomycin, and 2-deoxyglucose (2-DG) were added at the indicated time points. Data are presented as the mean ± SEM (n = 3 in triplicate). (D and E) MKN28 viperin-KD cells were incubated in glucose-free media (D) or treated with ranolazine (E) for 24 hours. Relative mRNA levels of the indicated genes were measured. Data are presented as the mean ± SEM (n = 2 in triplicate). *P < 0.05, **P < 0.01, and ***P < 0.001, by 1-way ANOVA with Dunnett’s multiple-comparison test (B, C, and D) or Tukey’s multiple-comparison test (E).

