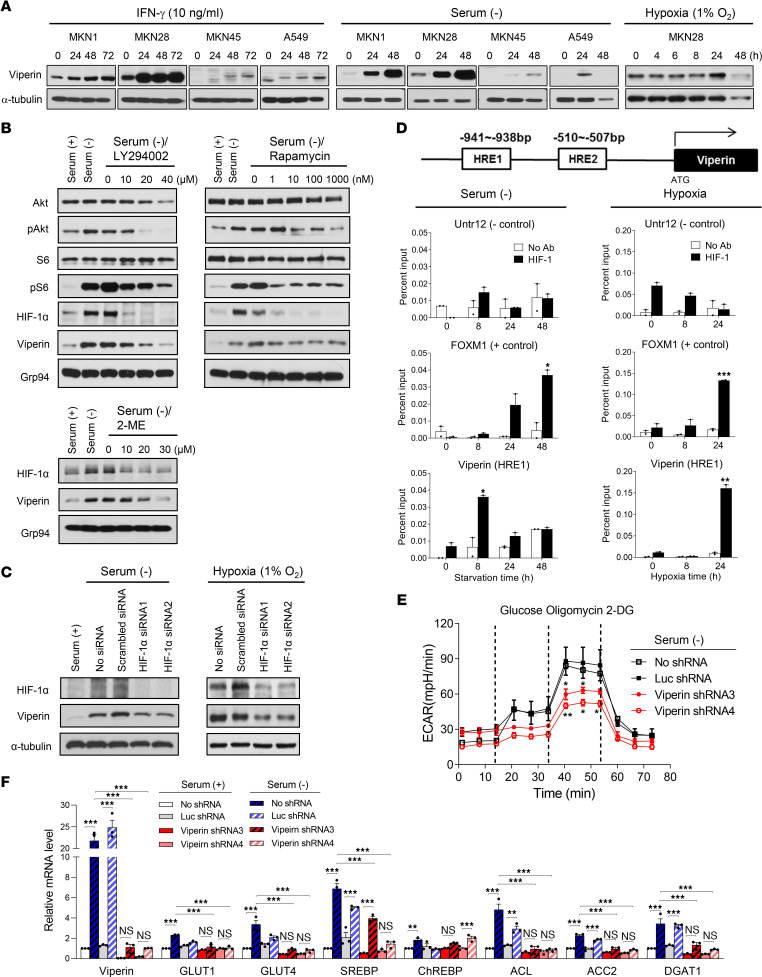
Figure 3. The mechanism of viperin induction in the TME.
(A) Viperin induction in cancer cell lines under various culture conditions. Cells were treated with IFN-γ, cultured in serum-free media, or incubated in a hypoxia chamber for the indicated durations. Viperin was detected by immunoblot using MaP.VIP. α-Tubulin was used as a loading control. (B) MKN28 cells were cultured in the presence and absence of serum and treated with LY294002 (a PI3K/AKT inhibitor), rapamycin (an mTOR inhibitor), or 2-ME (an HIF-1α inhibitor) at the indicated concentration for 48 hours. Each protein was detected by immunoblot using specific mAbs. Grp94 was used as a loading control. (C) MKN28 cells were transfected with control or HIF-1α siRNAs and then cultured in the presence and absence of serum for 48 hours or incubated in a hypoxia chamber for 24 hours. Each protein was detected by immunoblot using specific mAbs. α-Tubulin was used as a loading control. (D) A ChIP assay was performed for MKN28 cells cultured in serum-free media or incubated in a hypoxia chamber for the indicated durations. A schematic representation of the HRE-binding sites in the viperin promoter region is shown. Chromatin samples were immunoprecipitated with a specific mAb against HIF-1 and assessed by real-time PCR. FOXM1 was used as a positive control and Untr12 as a negative control. Data are presented as the mean ± SEM (n = 2 in triplicate). (E and F) The ECAR (E) and lipogenesis levels (F) were measured in MKN28 stable cell lines cultured in serum-free media for 48 hours. Glucose, oligomycin, and 2-DG were added at the indicated time points (E). Relative mRNA levels of the indicated genes were measured by qRT-PCR and normalized to ACTB mRNA (F). Data are presented as the mean ± SEM (n = 2 in triplicate). *P < 0.05, **P < 0.01, and ***P < 0.001, by Student’s t test (D) and 1-way ANOVA with Dunnett’s multiple-comparison test (E) or Tukey’s multiple-comparison test (F).

