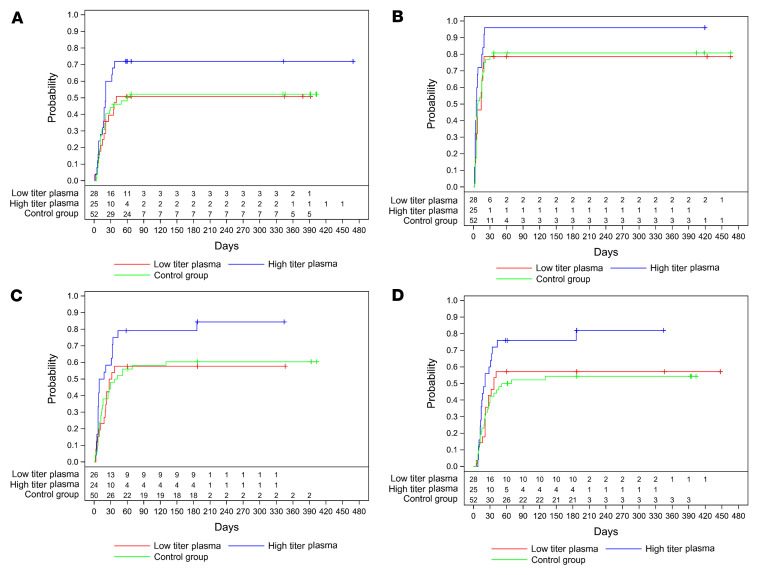
Figure 3. Long-term occurrence of secondary outcomes by amount of transfused neutralizing units.
Kaplan-Meier cumulative estimates of probability are shown. In all panels, a “+” indicates a censored patient. (A) The key secondary outcome time to clinical improvement compared in the CCP subgroup that received a low cumulative amount of neutralizing units (red), the CCP subgroup that received a high cumulative amount of neutralizing units (blue), and the control group (green line). P = 0.088 (log-rank test; high amount vs. control group). (B) Time to first negative PCR compared in the CCP subgroup that received a low cumulative amount of neutralizing units (red), the CCP subgroup that received a high cumulative amount of neutralizing units (blue), and the control group (green line). P = 0.019 (log-rank test, high amount vs. control group). (C) Probability of discharge from ICU compared in the CCP subgroup that received a low cumulative amount of neutralizing units (red), the CCP subgroup that received a high cumulative amount of neutralizing units (blue), and the control group (green line). P = 0.025 (log-rank test, high amount group vs. control group). (D) Probability of discharge from hospital compared in the CCP subgroup that received a low cumulative amount of neutralizing units (red), the CCP subgroup that received a high cumulative amount of neutralizing units (blue), and the control group (green line). P = 0.017 (log-rank test, high amount vs. control group).

