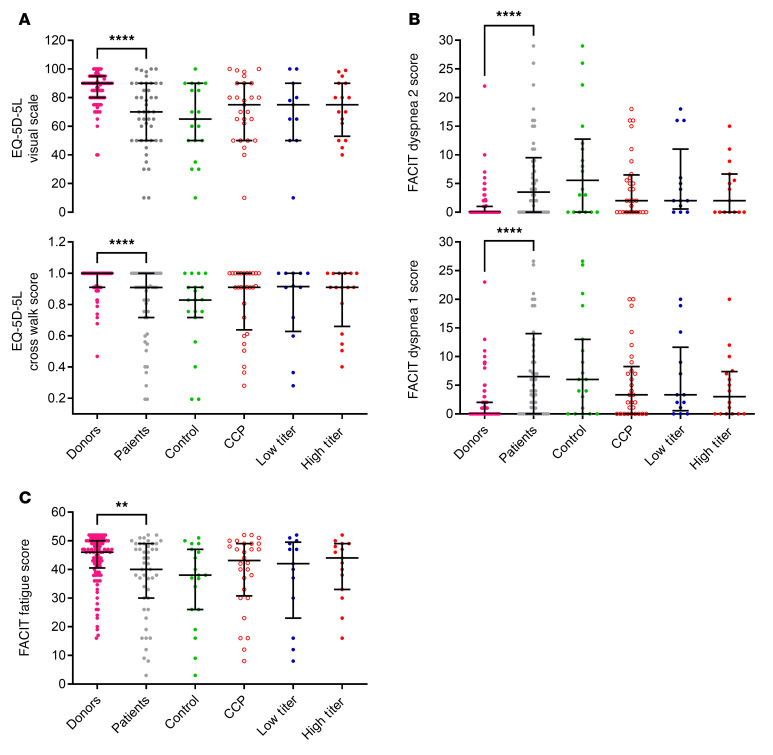
Figure 5. Quality of life score.
Data given as median and interquartile ranges. (A) EQ-5D-5L visual scale: Donors (n = 107) versus patients (n = 46) (****P < 0.0001), control group (n = 19) versus CCP group (n = 27) (P = 0.355), and control group versus CCP that received a high cumulative amount of neutralizing units (n = 16) (P = 0.730). No test was performed for the group that received a low cumulative amount of neutralizing units (n = 11). Cross walk score: donors (n = 105) versus patients (n = 47) (****P < 0.0001), control group (n = 19) versus CCP group (n = 28) (P = 0.280), and control group versus CCP subgroup that received a high cumulative amount of neutralizing units (n = 16) (P = 0.702). No test was performed for the group that received a low cumulative amount of neutralizing units (n = 12). (B) FACIT Dyspnea score 1: Donors (n = 107) versus patients (n = 48) (****P < 0.0001), control group (n = 19) versus CCP group (n = 29) (P = 0.196), and control group versus CCP subgroup that received a high cumulative amount of neutralizing units (n = 16) (P = 0.518). No test was performed for the group that received a low cumulative amount of neutralizing units (n = 13). FACIT Dyspnea score 2: Donors (n = 107) versus patients (n = 46) (****P < 0.0001), control group (n = 18) versus CCP group (n = 28) (P = 0.15), and control group versus CCP subgroup that received a high cumulative amount of neutralizing units (n = 15) (P = 0.446). No test was performed for the group that received a low cumulative amount of neutralizing units (n = 13). (C) FACIT Fatigue score: Donors (n = 105) versus patients (n = 47) (**P = 0.004), control group (n = 19) versus CCP group (n = 28) (P = 0.306), and control group versus CCP subgroup that received a high cumulative amount of neutralizing units (n = 15) (P = 0.492). No test was performed for the group that received a low cumulative amount of neutralizing units (n = 13). The Mann-Whitney test was used for calculation of P values.

