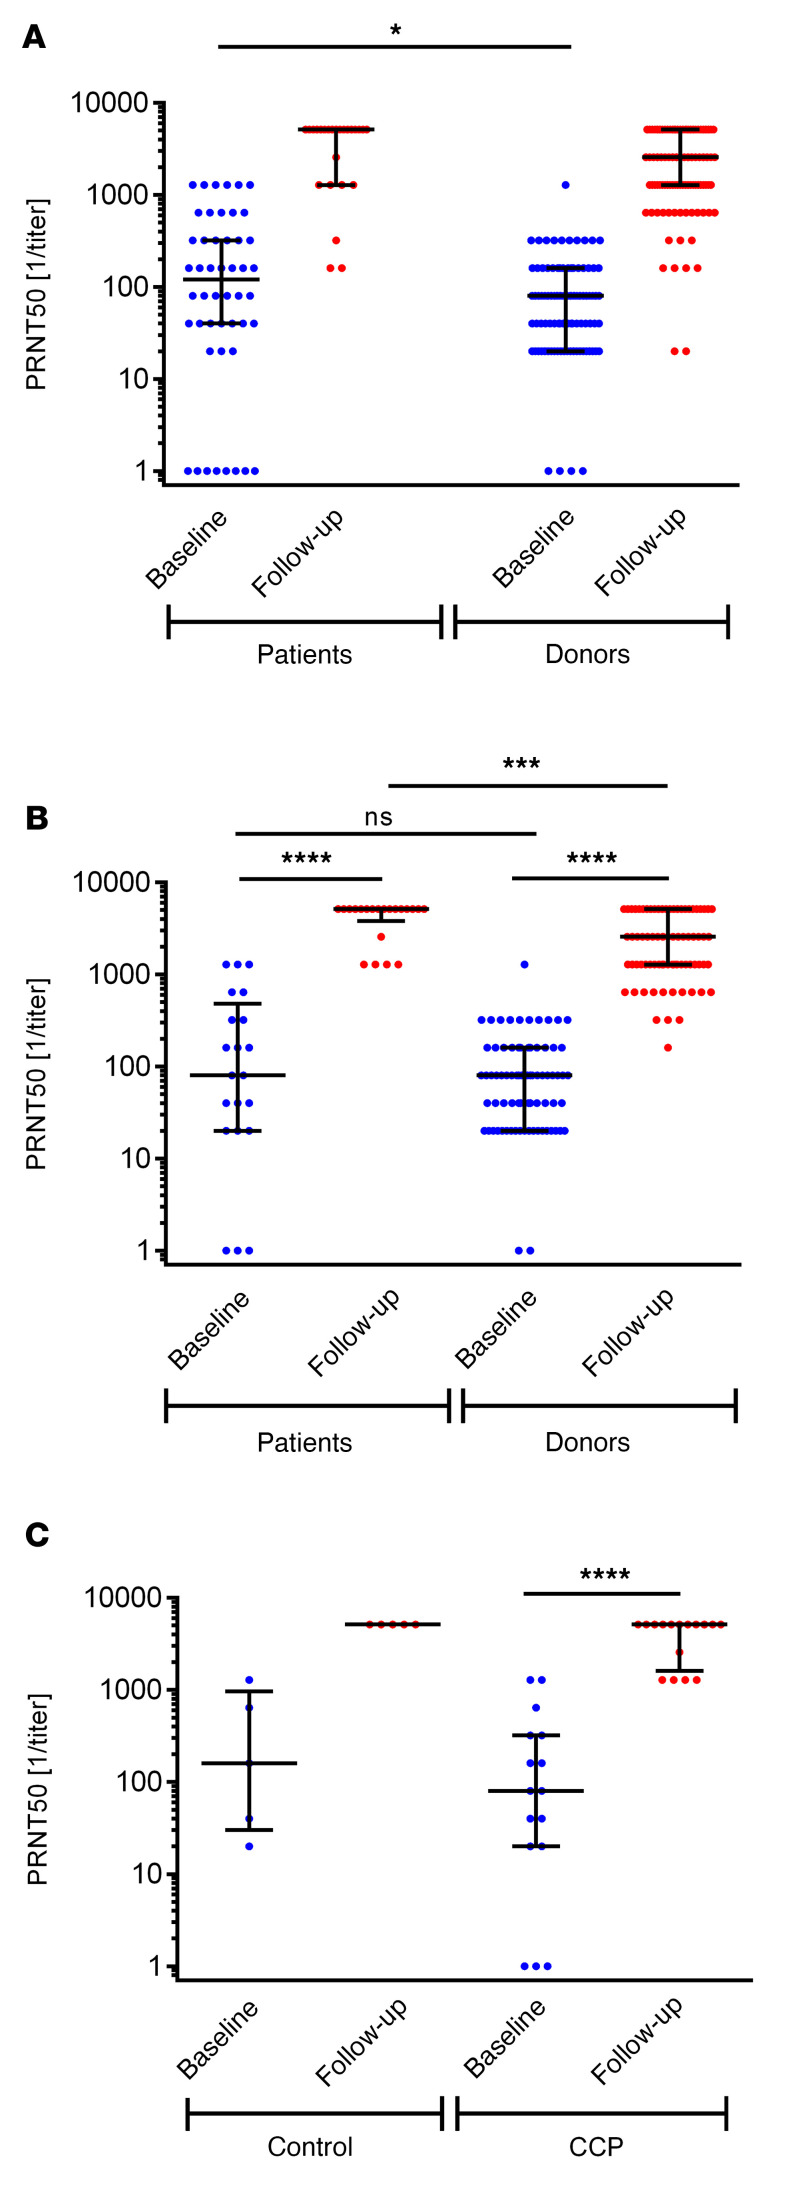
Figure 6. Neutralizing anti–SARS-CoV-2 antibodies (PRNT50) at baseline and last follow-up.
(A) Neutralizing antibodies of all study participants as available. Follow-up data of patients (n = 25) and donors (n = 95). Baseline values donors (n = 97) versus patients (n = 48): *P = 0.045. (B) Neutralizing antibodies of vaccinated study participants during follow-up with available baseline and follow-up data. Patients (n = 21) baseline versus follow-up values: ****P < 0.0001. Donors (n = 76) baseline versus follow up values: ****P < 0.0001. Follow-up values patients versus donors: ***P = 0.0005. (C) Vaccinated patients with available baseline and follow-up data by randomization group (CCP [n = 16] and control group [n = 5]). Baseline versus follow-up in CCP patients: ****P < 0.0001. No test was performed for control because of the low patient number. Horizontal lines indicate the median and interquartile ranges. The Mann-Whitney test was used for calculation of P values for unpaired analysis and Wilcoxon’s matched-pair test for comparison of matched pairs.

