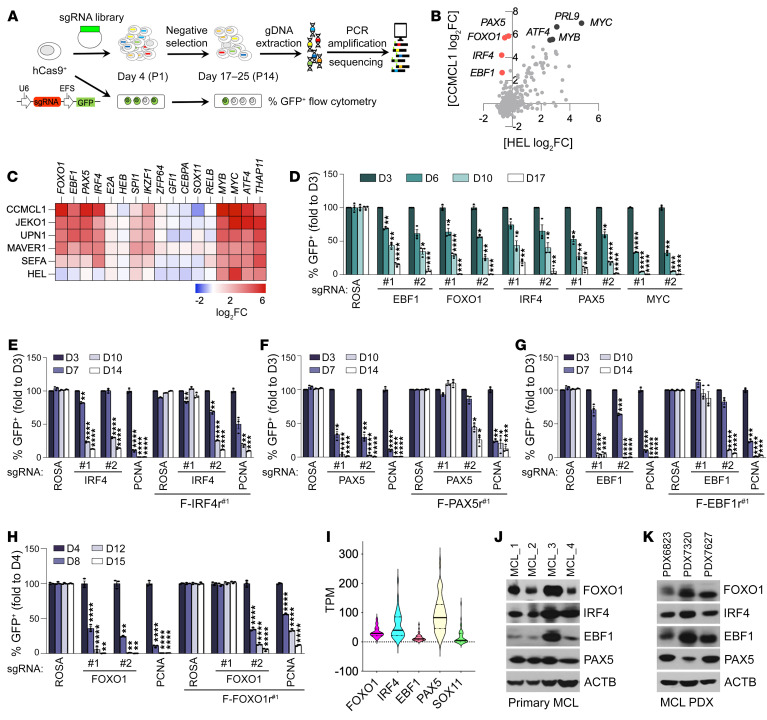
Figure 1. Domain-focused CRISPR/Cas9 screening identifies core TFs essential for MCL proliferation and survival.
(A) Experimental schematic for the CRISPR/Cas9 screen and the competition-based GFP dropout proliferation assay. (B) Scatterplot analysis of TF dependencies in CCMCL1 cells (y axis) versus HEL cells (x axis) ranked by the average sgRNA log2 fold change (log2FC) of each gene in the pooled CRISPR screen. (C) Heatmap depicts log2FC of sgRNA abundance of selected genes (averaging each independent sgRNA targeting a gene). (D) Competition-based proliferation assays to validate the results from the pooled screen. Experiments were conducted by transduction of Cas9-expressing JEKO1 cells with indicated lentivirus sgRNAs that coexpress a GFP reporter. Plotted is the percentage of GFP-positive cells (normalized to the day 3 measurement) at the indicated time points during culturing. sgRNAs targeting ROSA and MYC are included as a nontargeting negative control and a positive control, respectively. (E–H) Verification of on-target effects of sgRNAs against IRF4 (E), PAX5 (F), EBF1 (G), and FOXO1 (H). Competition-based proliferation assays in CCMCL1 cells expressing control or 3× FLAG–tagged and CRISPR-resistant synonymous IRF4 (F-IRF4r#1), PAX5 (F-PAX5r#1), EBF1 (F-EBF1r#1), and FOXO1 (F-FOXO1r#1) mutants. The indicated CRISPR-resistant synonymous mutants were designed specifically for sgIRF4#1, sgPAX5#1, sgEBF1#1, and sgFOXO1#1. (I) Violin plots of RNA expression levels in transcripts per million (TPM) of indicated TFs in patient MCL cells (n = 37). RNA-Seq data were reanalyzed from GSE141336 of Zhao et al. (38). (J and K) Immunoblot analysis of patient MCL cells (J) and patient-derived xenografts (PDX) (K). (D–H) Data represent mean ± SEM (n = 3). Results are representative of 2 independent experiments. Statistical analysis was performed using 1-way ANOVA with Tukey’s multiple-comparison test. *P < 0.05, **P < 0.001, ***P < 0.0005, ****P < 0.0001.

