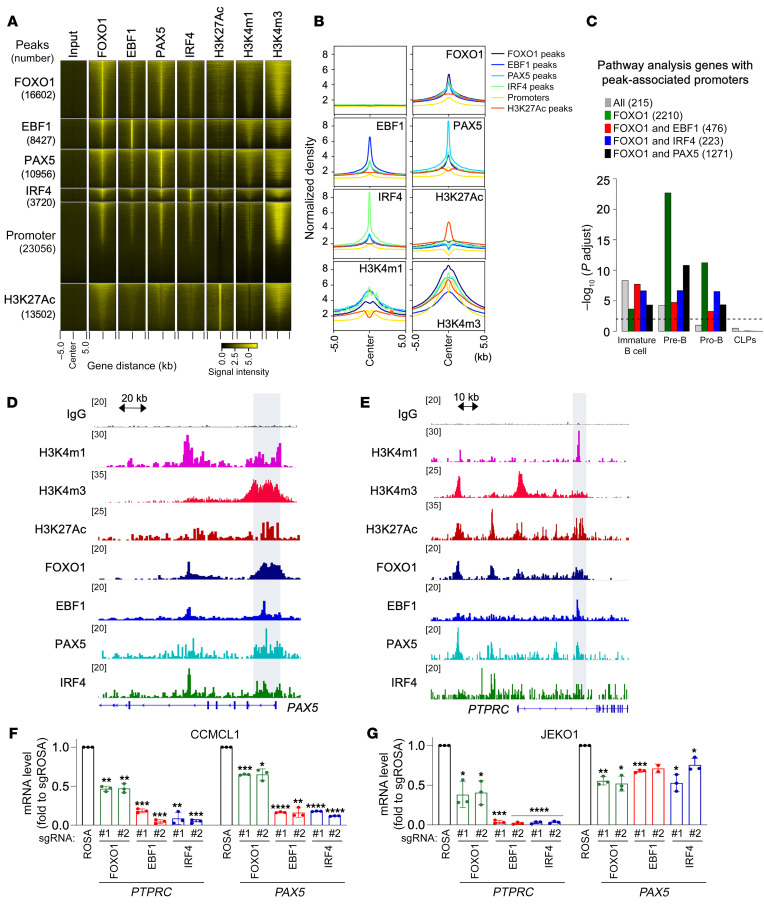
Figure 2. Colocalization of MCL survival TFs facilitates collaborative regulation of B cell fate genes.
(A) Heatmap of signals from input, FOXO1, EBF1, PAX5, IRF4, H3K27ac, H3K4m1, and H3K4m3 ChIP-Seq from CCMCL1 cells at ChIP-Seq peaks (number) as well as promoters of UCSC genes. The window extends 5 kb in each direction from the center of ChIP-Seq peaks or transcription start sites. (B) Histogram view of A. (C) Enrichment analysis of genes (number) with ChIP-Seq peak–associated promoters within gene sets highly expressed at each of the 4 developmental stages in the healthy B cells. Adjusted P values were calculated by a hypergeometric test followed by a Benjamini-Hochberg procedure. The black dashed line represents FDR cutoff 0.01. CLP, common lymphoid progenitor. (D and E) Visualization of representative ChIP-Seq tracks for indicated B cell genes. (F and G) Verification of TF regulation in MCL. At 72 hours after transduction of indicated sgRNAs, CCMCL1 or JEKO1 cells were analyzed for PTPRC and PAX5 mRNA levels by RT-qPCR). Data represent mean ± SEM (n = 3). Results are representative of 3 or 4 independent experiments. Statistical analysis in F and G was performed using 2-tailed unpaired Student’s t test. *P < 0.05, **P < 0.005, ***P = 0.0005, ****P < 0.0001.

