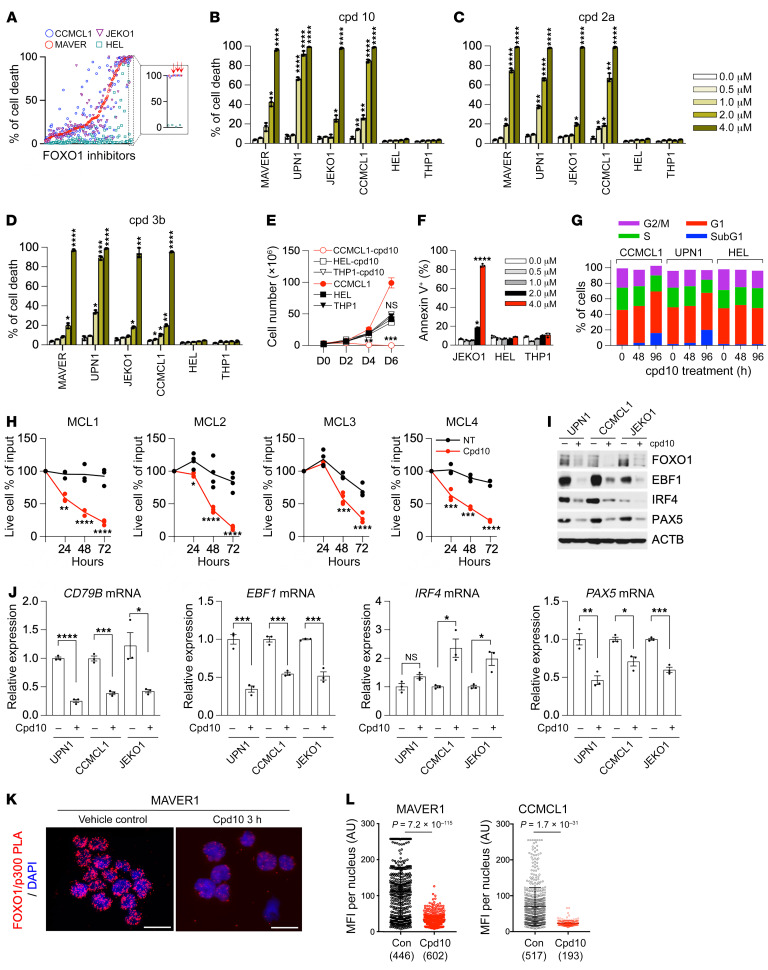
Figure 6. Cpd10 is a FOXO1-specific inhibitor that suppresses MCL growth in vitro.
(A) Ranking of cell death induction activity of 144 FOXO1 small-molecule inhibitors. Cell death was measured by TO-PRO-3 cell death assay (Thermo Fisher Scientific) after 6-day treatment of compounds (4 μM) in 4 indicated cell lines. Red arrows point to the selected inhibitors for follow-up studies. (B–D) Dose-dependent effect of FOXO1 inhibitors on MCL and AML cell lines. Relative cell death (percent) was determined by TO-PRO-3 staining at day 6 under treatment of the indicated compounds. (E) Growth curve of CCMCL1, HEL, and THP1 cells under cpd10 (2 μM). (F) Percentage of annexin V–positive JEKO1, HEL, and THP1 cells at day 6 following treatment with cpd10 (2 μM). (G) Cell cycle distribution of cells treated with cpd10 (2 μM). (H) Primary MCL cells were cultured with cpd10 (2 μM) or vehicle. Data represent mean ± SEM (n = 4, MCL1, MCL4; n = 3, MCL2, MCL3). Results are representative of 2 independent experiments. (I and J) Immunoblot (I) and RT-qPCR assay (J) of CD79B, EBF1, IRF4, or PAX5 mRNA expression in 3 indicated control and cpd10-treated cell lines. Total RNAs were prepared after 48 hours of treatment. (K) Representative proximity ligation assay (PLA) image of MAVER1 cells demonstrating the inhibition of interaction between FOXO1 and p300 in response to 2 μM cpd10. Scale bars: 20 μm. (L) Quantitation of mean fluorescence intensity (MFI) of PLA signal per nuclei from MAVER1 or CCMCL1 cells. The number of nuclei scored is indicated. (B–F, J, and L) Data represent mean ± SEM (n = 3). Results are representative of 3 independent experiments. Statistical analysis was performed using 1-way ANOVA with Tukey’s multiple-comparison test in B–D and using 2-tailed unpaired Student’s t test in E, F, H, J, and L. *P < 0.05, **P < 0.001, ***P < 0.0005, ****P < 0.0001.

