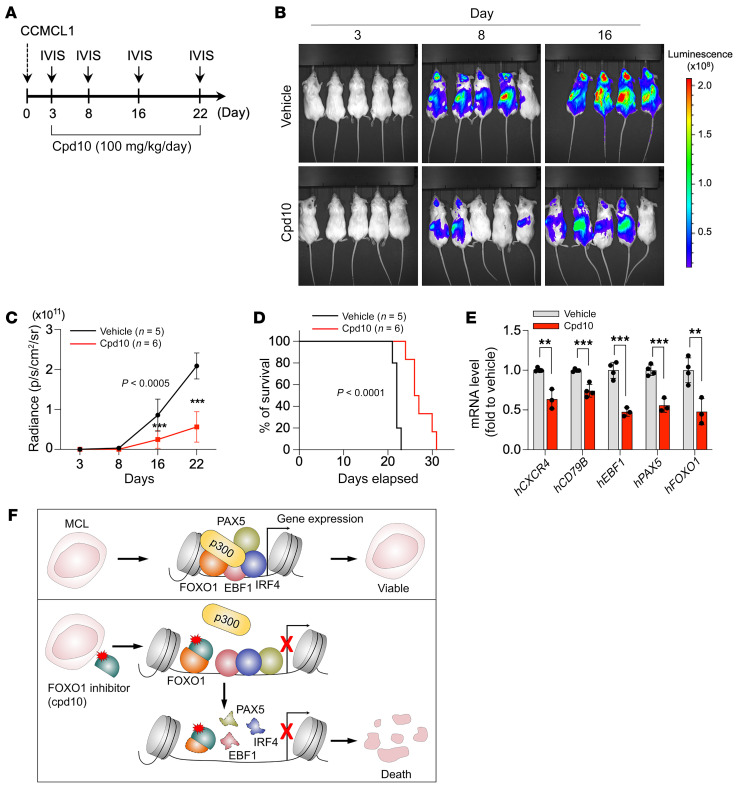
Figure 7. Pharmacological inhibition of FOXO1 suppresses MCL progression in vivo.
(A) Experimental design of the in vivo treatment. (B) Bioluminescent imaging of CCMCL1 MCL recipient mice at the indicated day after initiation of treatment with cpd10 (100 mg/kg/d) or vehicle control. (C) Quantification of bioluminescent imaging responses to cpd10 treatment. Mean values of vehicle-treated (n = 5) and cpd10-treated (n = 6) mice are shown. Data represent mean ± SEM (n = 5 or 6). Results are representative of 2 independent experiments. Statistical analysis was performed using 2-tailed unpaired Student’s t test. ***P < 0.0005. (D) Kaplan-Meier survival curves of control and cpd10-treated mice. Statistical significance was determined using a log-rank test. (E) RT-qPCR analysis of indicated human genes in vehicle- and cpd10-treated spleens of CCMCL1 MCL recipient mice. Data represent mean ± SEM (n = 3 or 4). Results are representative of 2 independent experiments. Statistical analysis was performed using 2-tailed unpaired Student’s t test. **P < 0.005, ***P < 0.0005. (F) Predicted model of MCL lineage-survival transcriptional program and its dissolution following targeted inhibition of FOXO1.

