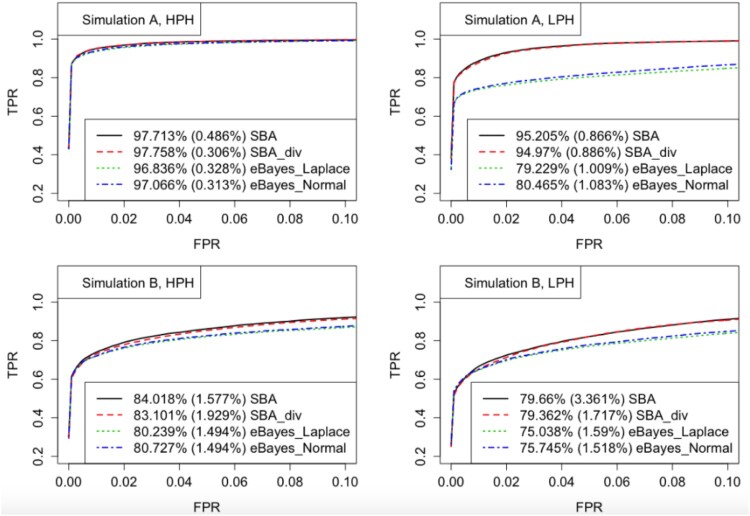
Figure 1.
ROC curves for Simulations A and B. Given each FPR level, the TPRs were averaged over 32 simulated datasets. The partial AUC values were calculated by averaging the percentages of the total area in the plotted region where FPR is below 0.1, and reported in the legends, with the standard deviations in parentheses.

