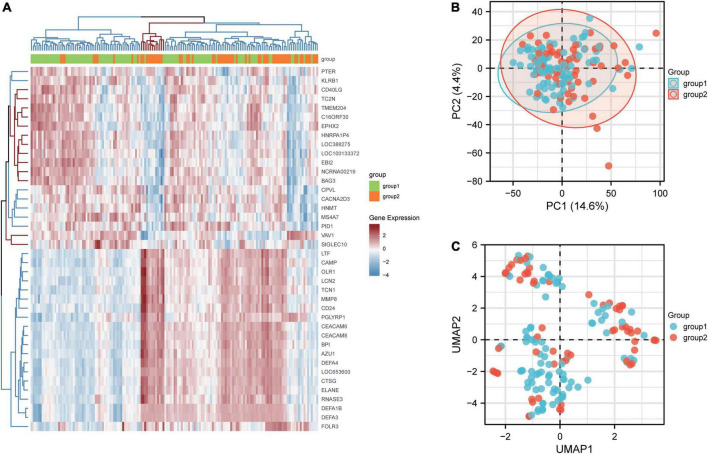
FIGURE 2.
Identification of DEGs between patients with and without renal involvement. (A) Heatmap of GSE65391, (B) principal component analysis (PCA) plot generated from DEGs in GSE49454, and (C) uniform Manifold Approximation and Projection (UMAP) showing distinct clusters of DEGs in GSE49454. Group1 stands for the patients without active renal involvement and group2 stands for patients with active renal involvement. Data points in red represent upregulated genes, and those in blue represent downregulated genes.

