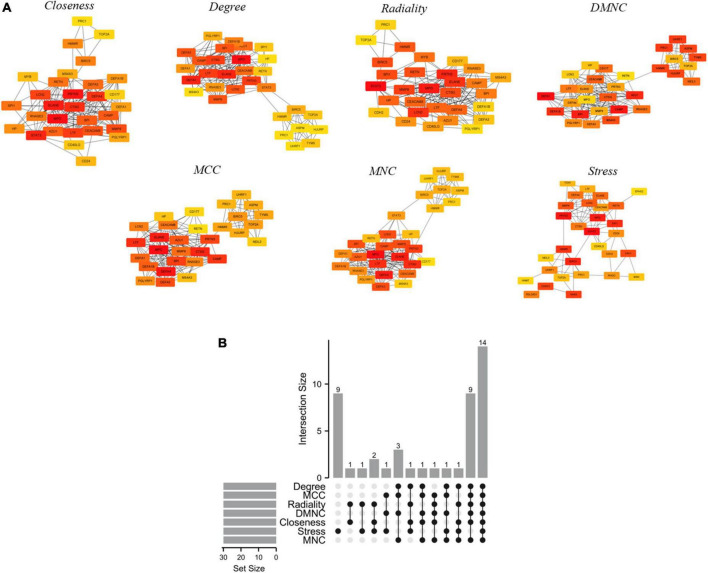
FIGURE 5.
Hub genes identified by different algorithms and UpSet diagram. (A) Hub gene identified by seven different algorithms (Degree, MNC, DMNC, MCC, Closeness, Radiality, and Stress) using Cytohubba. Node color reflects the degree of connectivity. Red represents a higher degree, and yellow represents a lower degree. (B) The UpSet diagram showed that the seven algorithms screened 14 overlapping hub genes.

