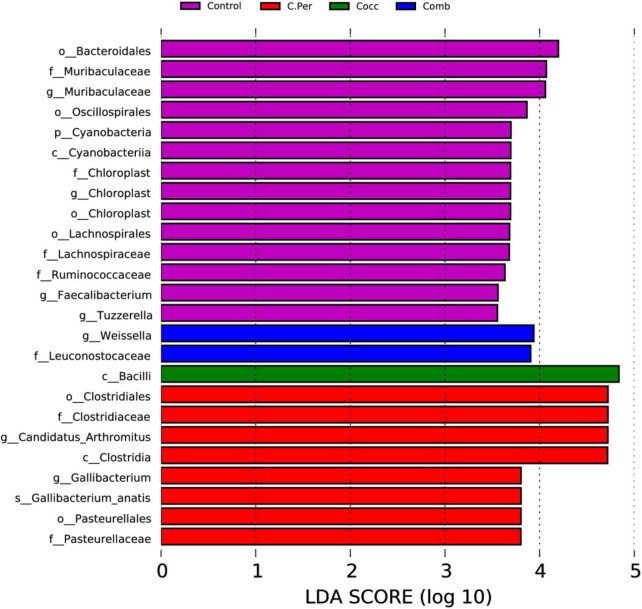
FIGURE 4.
linear discriminant analysis (LDA) effect size (LEfSe) Analysis of differential species among all groups shown in the LDA value distribution histogram. The presented species are biomarkers with statistical differences between groups (LDA > 3.5). The length of the histogram (LDA score) represents the impact of the different species.

